Overview
{gsm.studykri} provides a new approach for calculating KRI lower and upper limits on study-level for quality monitoring in clinical trials. The method uses bootstrapping to calculate confidence intervals for a given study over-time. The confidence intervals can then be used to compare the study-level KRI against a fixed expectation or against the confidence intervals and KRI values over time of one or more reference studies. The bootstrapping method resamples a new set of sites with replacement from the original study data set.
Example: Adverse Event Rate per Visit
This example demonstrates calculating a single KRI (AE per visit) using the script-based approach without YAML workflows.
library(dplyr)
#> Warning: package 'dplyr' was built under R version 4.4.3
#>
#> Attaching package: 'dplyr'
#> The following objects are masked from 'package:stats':
#>
#>     filter, lag
#> The following objects are masked from 'package:base':
#>
#>     intersect, setdiff, setequal, union
library(gsm.studykri)

# Simulate portfolio with 4 studies
lRaw <- list(
  Raw_SITE = clindata::ctms_site,
  Raw_STUDY = clindata::ctms_study,
  Raw_AE = clindata::rawplus_ae,
  Raw_SUBJ = clindata::rawplus_dm,
  Raw_VISIT = clindata::rawplus_visdt
)

# Add required subject identifier columns for resampling
lRaw$Raw_SUBJ$subjectname <- lRaw$Raw_SUBJ$subject_nsv
lRaw$Raw_SUBJ$subjectenrollmentnumber <- lRaw$Raw_SUBJ$subjectid

lPortfolio <- SimulatePortfolio(
  lRaw = lRaw,
  nStudies = 4,
  vSubjectIDs = c("subjid", "subjectenrollmentnumber", "subject_nsv", "subjectname", "subjectid"),
  dfConfig = tibble(
    studyid = c("AA-1", "AA-2", "AA-3", "AA-4"),
    nSubjects = c(500, 750, 150, 200),
    strOversampleDomain = rep("Raw_AE", 4),
    vOversamplQuantileRange_min = c(0, 0, 0, 0),
    vOversamplQuantileRange_max = c(1, 1, 1, 0.75)
  )
)
#> Filtered to 1016 subjects with Raw_AE records in 0.00-1.00 quantile range (1-31 records)
#> Filtered to 1016 subjects with Raw_AE records in 0.00-1.00 quantile range (1-31 records)
#> Filtered to 1016 subjects with Raw_AE records in 0.00-1.00 quantile range (1-31 records)
#> Filtered to 773 subjects with Raw_AE records in 0.00-0.75 quantile range (1-6 records)

# Calculate site-level counts by month for AE per visit
dfInput <- Input_CountSiteByMonth(
  dfSubjects = lPortfolio$Raw_SUBJ,
  dfNumerator = lPortfolio$Raw_AE,
  dfDenominator = lPortfolio$Raw_VISIT |>
    mutate(visit_dt = as.Date(visit_dt)),
  strStudyCol = "studyid",
  strGroupCol = "invid",
  strGroupLevel = "Site",
  strSubjectCol = "subjid",
  strNumeratorDateCol = "aest_dt",
  strDenominatorDateCol = "visit_dt",
  nMinDenominator = 25 # Normalize dates at the threshold
)

# Aggregate to study-level cumulative counts
dfTransformed <- Transform_CumCount(
  dfInput,
  vBy = c("StudyID")
)

# Calculate 95% confidence bounds using bootstrap
dfBounds <- dfInput |>
  Analyze_StudyKRI_PredictBounds()
#> Using all 4 studies found in dfInput

# Calculate reference bounds from AA-2, AA-3, AA-4
dfStudyRef <- tibble(
  study = "AA-1",
  studyref = c("AA-2", "AA-3", "AA-4")
)

dfBoundsRef <- Analyze_StudyKRI_PredictBoundsRef(dfInput, dfStudyRef)
#> Calculated minimum group count: 69

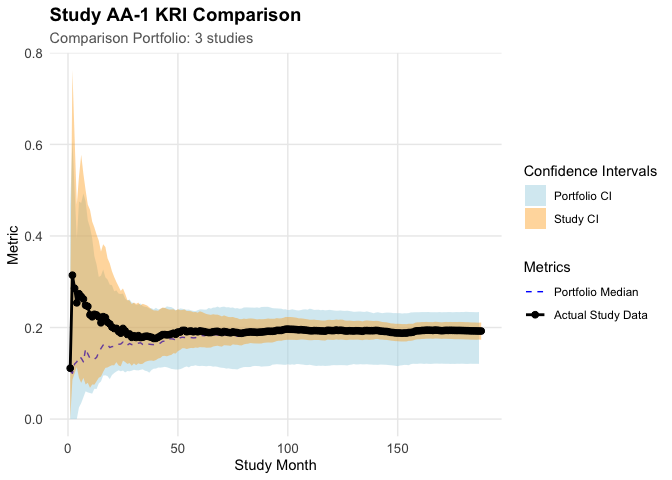
# Plot AA-1 vs reference portfolio
Visualize_StudyKRI(
  dfStudyKRI = dfTransformed,
  dfBounds = dfBounds,
  dfBoundsRef = dfBoundsRef,
  strStudyID = "AA-1"
)
Implemented KRIs
The package includes 14 pre-configured KRI workflows:
| ID | Abbreviation | Metric | Numerator | Denominator |
|---|---|---|---|---|
| kri0001 | AE | Adverse Event Rate per Days on Study | Adverse Events | Days on Study |
| kri0002 | SAE | Serious Adverse Event Rate per Days on Study | Serious Adverse Events | Days on Study |
| kri0003 | PD | Non-Important Protocol Deviation Rate | Non-Important Protocol Deviations | Days on Study |
| kri0004 | IPD | Important Protocol Deviation Rate | Important Protocol Deviations | Days on Study |
| kri0005 | LB | Grade 3+ Lab Abnormality Rate | Grade 3+ Abnormal Labs Samples | Total Lab Samples |
| kri0006 | SDSC | Study Discontinuation Rate | Subjects Discontinued - Study | Enrolled Subjects |
| kri0007 | TDSC | Treatment Discontinuation Rate | Subjects Discontinued - Treatment | Enrolled Subjects |
| kri0008 | QRY | Query Rate | Queries | Total Data Points |
| kri0009 | OQRY | Delayed Query Resolution Rate | Queries That Were Open > 30 Days | Total Queries |
| kri0010 | ODAT | Delayed Data Entry Rate | Data Pages Entered > 10 Days | Total Data Pages |
| kri0011 | CDAT | Data Change Rate | Data Points with 1+ Change | Total Data Points |
| kri0012 | SF | Screen Failure Rate | Screen Failures | Screened Subjects |
| kri0013 | PK | PK Collection Compliance Rate | PK Samples Collected | PK Samples Expected |
| kri0014 | IE | Inclusion/Exclusion Violation Rate | Number of subjects ineligible | Enrolled Subjects |
All KRIs use bootstrap-based confidence intervals at site level with a default of 1000 bootstrap replicates and 95% confidence level.
AI Disclaimer
This package and documentation were developed with assistance from AI tools, including Cursor and Claude Sonnet 4.5. All AI-generated content has been reviewed.
Quality Control
This project was developed until MVP a2d4e9d8d588e87c3708168261505ac3da52a912
Since {gsm} is designed for use in a GCP framework, we have since extensive quality control as part of our development process. In particular, we do the following during early development:
- Unit Tests - Unit tests are written for all core functions, 100% coverage required.
- Workflow Tests - Additional unit tests confirm that core workflows behave as expected.
- Function Documentation - Detailed documentation for each exported function with examples is maintained with Roxygen.
- Package Checks - Standard package checks are run using GitHub Actions and must be passing before PRs are merged.
- Continuous Integration - Continuous integration is provided via GitHub Actions.
- Code Formatting - Code is formatted with {styler} before each release.
- Contributor Guidelines - Detailed contributor guidelines including step-by-step processes for code development and releases are provided as a vignette.
- Code Demonstration - Cookbook Vignette provides demos and explanations for code usage.
Parking
As development progresses, we will also conduct the following quality control steps:
- Qualification Workflow - All assessments have been Qualified as described in the Qualification Workflow Vignette. A Qualification Report Vignette is generated and attached to each release.
- Code Review - Code review is conducted using GitHub Pull Requests (PRs), and a log of all PRs is included in the Qualification Report Vignette.
- Data Specifications - Machine-readable data specifications are maintained for all KRIs. Specifications are automatically added to relevant function documentation.
- Regression Testing - Extensive QC and testing is done before each release.