In-Database Compatibility
db.RmdLoad
suppressPackageStartupMessages(library(dplyr))
library(gsm.core)
library(gsm.mapping)
library(gsm.kri)
library(gsm.reporting)
library(gsm.studykri)
#>
#> Attaching package: 'gsm.studykri'
#> The following object is masked from 'package:gsm.reporting':
#>
#>     BindResults
Introduction
{gsm.studykir} functions can be executed on a database back-end instead of relying on in-memory calculations.
The package supports various database backends including DuckDB,
PostgreSQL, and Snowflake. For backends that use large integer values
for random number generation (such as Snowflake), use the
vDbIntRandomRange parameter in bootstrap functions to
ensure proper normalization of random values.
Database Backend Compatibility
Random Number Generation
Most SQL databases translate R’s runif() to a
RANDOM() function that returns decimal values between 0 and
1. However, some databases (notably Snowflake) return large integers
instead. For these backends, you must specify the integer range using
the vDbIntRandomRange parameter.
Common Random Number Ranges:
-
Snowflake (signed 64-bit):
c(-9223372036854775808, 9223372036854775807)(range: −2^63 to 2^63−1) -
Standard databases (DuckDB, PostgreSQL, etc.):
NULL(default, returns 0-1 decimals)
When vDbIntRandomRange is specified, the package
automatically normalizes the integer values to the 0-1 range using the
formula:
normalized_value = (random_value - min_value) / (max_value - min_value)How to determine your database’s random range:
If you’re unsure whether your database backend needs normalization, run this query:
If the values are between 0 and 1, use the default
(vDbIntRandomRange = NULL). If they’re large integers,
specify the appropriate range.
Simulate Data Set and Save to DuckDb
We use the clindata package which includes data from one clinical study to simulate new study data. We create a portfolio with study AA-4 oversampling patients with low AE counts.
lRaw <- list(
  Raw_SITE = clindata::ctms_site,
  Raw_STUDY = clindata::ctms_study,
  Raw_PD = clindata::ctms_protdev,
  Raw_DATAENT = clindata::edc_data_pages,
  Raw_DATACHG = clindata::edc_data_points,
  Raw_QUERY = clindata::edc_queries,
  Raw_AE = clindata::rawplus_ae,
  Raw_SUBJ = clindata::rawplus_dm,
  Raw_ENROLL = clindata::rawplus_enroll,
  Raw_Randomization = clindata::rawplus_ixrsrand,
  Raw_LB = clindata::rawplus_lb,
  Raw_SDRGCOMP = clindata::rawplus_sdrgcomp,
  Raw_STUDCOMP = clindata::rawplus_studcomp,
  Raw_IE = clindata::rawplus_ie,
  Raw_VISIT = clindata::rawplus_visdt %>%
    mutate(visit_dt = lubridate::ymd(visit_dt))
)

# Add required subject identifier columns for resampling
lRaw$Raw_SUBJ$subjectname <- lRaw$Raw_SUBJ$subject_nsv
lRaw$Raw_SUBJ$subjectenrollmentnumber <- lRaw$Raw_SUBJ$subjid

lPortfolio <- SimulatePortfolio(
  lRaw = lRaw,
  nStudies = 4,
  vSubjectIDs = c("subjid", "subjectenrollmentnumber", "subject_nsv", "subjectname", "subjectid"),
  dfConfig = tibble(
    studyid = c("AA-1", "AA-2", "AA-3", "AA-4"),
    nSubjects = c(500, 750, 150, 200),
    strOversampleDomain = rep("Raw_AE", 4),
    vOversamplQuantileRange_min = c(0, 0, 0, 0),
    vOversamplQuantileRange_max = c(1, 1, 1, 0.75)
  )
)
#> Filtered to 1016 subjects with Raw_AE records in 0.00-1.00 quantile range (1-31 records)
#> Filtered to 1016 subjects with Raw_AE records in 0.00-1.00 quantile range (1-31 records)
#> Filtered to 1016 subjects with Raw_AE records in 0.00-1.00 quantile range (1-31 records)
#> Filtered to 773 subjects with Raw_AE records in 0.00-0.75 quantile range (1-6 records)

con <- DBI::dbConnect(duckdb::duckdb(), ":memory:")

purrr::walk2(names(lPortfolio), lPortfolio, ~ DBI::dbWriteTable(con, .x, .y))

dbPortfolio <- purrr::map(names(lPortfolio), ~ tbl(con, .x))
names(dbPortfolio) <- names(lPortfolio)
Here we create our data set.
tblInput1 <- gsm.studykri::Input_CountSiteByMonth(
  dfSubjects = dbPortfolio$Raw_SUBJ,
  dfNumerator = dbPortfolio$Raw_AE,
  dfDenominator = dbPortfolio$Raw_VISIT,
  strStudyCol = "studyid",
  strGroupCol = "invid",
  strGroupLevel = "Site",
  strSubjectCol = "subjid",
  strNumeratorDateCol = "aest_dt",
  strDenominatorDateCol = "visit_dt",
  strDenominatorType = "Visit"
)

tblInput2 <- gsm.studykri::Input_CountSiteByMonth(
  dfSubjects = dbPortfolio$Raw_SUBJ,
  dfNumerator = dbPortfolio$Raw_AE %>%
    filter(aeser == "Y"),
  dfDenominator = dbPortfolio$Raw_VISIT,
  strStudyCol = "studyid",
  strGroupCol = "invid",
  strGroupLevel = "Site",
  strSubjectCol = "subjid",
  strNumeratorDateCol = "aest_dt",
  strDenominatorDateCol = "visit_dt",
  strDenominatorType = "Visit"
)

tblInput <- dplyr::union_all(
  tblInput1 %>%
    mutate(MetricID = "kri0001"),
  tblInput2 %>%
    mutate(MetricID = "kri0002"),
)

# Load metric metadata from workflow files
metrics_wf <- gsm.core::MakeWorkflowList(
  strNames = c("kri0001.yaml", "kri0002.yaml"),
  strPath = system.file("workflow/2_metrics", package = "gsm.studykri"),
  strPackage = NULL
)

dfMetrics <- gsm.reporting::MakeMetric(metrics_wf)

lJoined <- JoinKRIByDenominator(tblInput, dfMetrics)

lJoined
#> $Visit
#> # Source:   SQL [?? x 7]
#> # Database: DuckDB 1.5.1 [unknown@Linux 6.17.0-1008-azure:R 4.5.3/:memory:]
#>    GroupID    GroupLevel Denominator StudyID MonthYYYYMM Numerator_kri0001
#>    <chr>      <chr>            <dbl> <chr>         <dbl>             <dbl>
#>  1 AA-1_0X035 Site                 1 AA-1         200508                 0
#>  2 AA-1_0X069 Site                 2 AA-1         200610                 1
#>  3 AA-1_0X069 Site                 2 AA-1         200605                 0
#>  4 AA-1_0X161 Site                 3 AA-1         200911                 3
#>  5 AA-1_0X096 Site                 1 AA-1         200711                 1
#>  6 AA-1_0X096 Site                 1 AA-1         200806                 0
#>  7 AA-1_0X096 Site                 1 AA-1         200812                 0
#>  8 AA-1_0X096 Site                 1 AA-1         200902                 0
#>  9 AA-1_0X096 Site                 1 AA-1         200905                 0
#> 10 AA-1_0X062 Site                 1 AA-1         201509                 0
#> # ℹ more rows
#> # ℹ 1 more variable: Numerator_kri0002 <dbl>
Next we prepare for the actual bootstrap simulation. For this we need to perform multiple cross joins that require the creation of temporary tables in the backend. {gsm.studykri} will attempt to create them using the connection attached to the lazy tables. However if write priveleges are not sufficient we can also create the tables manually and pass them to the relevant functions.
dfStudyRef <- tibble(
  StudyID = "AA-1",
  StudyRef = c("AA-2", "AA-3", "AA-4")
)

dfRep <- tibble(
  BootstrapRep = seq(1, 100)
)

dfMonths <- tibble(
  YYYY = seq(2003, 2020)
) %>%
  cross_join(
    tibble(
      MM = seq(1, 12)
    )
  ) %>%
  mutate(
    MonthYYYYMM = YYYY * 100 + MM
  ) %>%
  select(MonthYYYYMM)

DBI::dbWriteTable(con, "StudyRef", dfStudyRef, overwrite = TRUE)
DBI::dbWriteTable(con, "Rep", dfRep, overwrite = TRUE)
DBI::dbWriteTable(con, "Months", dfMonths, overwrite = TRUE)


tblStudyRef <- tbl(con, "StudyRef")
tblRep <- tbl(con, "Rep")
tblMonths <- tbl(con, "Months")


Bounds_Wide <- purrr::map(
  lJoined, ~ Analyze_StudyKRI_PredictBounds(
    .,
    dfStudyRef = tblStudyRef,
    tblBootstrapReps = tblRep,
    tblMonthSequence = tblMonths
  )
)

BoundsRef_Wide <- purrr::map(
  lJoined, ~ Analyze_StudyKRI_PredictBoundsRef(
    .,
    dfStudyRef = tblStudyRef,
    tblBootstrapReps = tblRep,
    tblMonthSequence = tblMonths
  )
)
#> Calculated minimum group count: 73

tblBounds <- Transform_Long(Bounds_Wide)

tblBoundsRef <- Transform_Long(BoundsRef_Wide)

tblTransformed <- union_all(
  tblInput1 %>%
    Transform_CumCount(vBy = "StudyID", tblMonthSequence = tblMonths) %>%
    mutate(MetricID = "kri0001"),
  tblInput2 %>%
    Transform_CumCount(vBy = "StudyID", tblMonthSequence = tblMonths) %>%
    mutate(MetricID = "kri0002"),
)


tblBounds
#> # Source:     SQL [?? x 8]
#> # Database:   DuckDB 1.5.1 [unknown@Linux 6.17.0-1008-azure:R 4.5.3/:memory:]
#> # Ordered by: StudyID, StudyMonth
#>    MetricID DenominatorType StudyID StudyMonth BootstrapCount Median  Lower
#>    <chr>    <chr>           <chr>        <dbl>          <int>  <dbl>  <dbl>
#>  1 kri0001  Visit           AA-1             2            100  0.211 0
#>  2 kri0001  Visit           AA-1            10            100  0.2   0.0972
#>  3 kri0001  Visit           AA-1            18            100  0.136 0.0953
#>  4 kri0001  Visit           AA-1            28            100  0.159 0.123
#>  5 kri0001  Visit           AA-1            29            100  0.163 0.132
#>  6 kri0001  Visit           AA-1            34            100  0.181 0.145
#>  7 kri0001  Visit           AA-1            39            100  0.181 0.148
#>  8 kri0001  Visit           AA-1            42            100  0.186 0.153
#>  9 kri0001  Visit           AA-1            47            100  0.186 0.155
#> 10 kri0001  Visit           AA-1            49            100  0.185 0.157
#> # ℹ more rows
#> # ℹ 1 more variable: Upper <dbl>

tblBoundsRef
#> Warning: Missing values are always removed in SQL aggregation functions.
#> Use `na.rm = TRUE` to silence this warning
#> This warning is displayed once every 8 hours.
#> # Source:     SQL [?? x 11]
#> # Database:   DuckDB 1.5.1 [unknown@Linux 6.17.0-1008-azure:R 4.5.3/:memory:]
#> # Ordered by: StudyMonth
#>    MetricID DenominatorType StudyMonth BootstrapCount GroupCount StudyCount
#>    <chr>    <chr>                <dbl>          <int>      <dbl>      <int>
#>  1 kri0001  Visit                  143            100         73          3
#>  2 kri0001  Visit                  154            100         73          3
#>  3 kri0001  Visit                  155            100         73          3
#>  4 kri0001  Visit                  160            100         73          3
#>  5 kri0001  Visit                  162            100         73          3
#>  6 kri0001  Visit                  163            100         73          3
#>  7 kri0001  Visit                  165            100         73          3
#>  8 kri0001  Visit                  166            100         73          3
#>  9 kri0001  Visit                  168            100         73          3
#> 10 kri0001  Visit                  172            100         73          3
#> # ℹ more rows
#> # ℹ 5 more variables: StudyID <chr>, StudyRefID <chr>, Median <dbl>,
#> #   Lower <dbl>, Upper <dbl>

tblTransformed
#> # Source:     SQL [?? x 8]
#> # Database:   DuckDB 1.5.1 [unknown@Linux 6.17.0-1008-azure:R 4.5.3/:memory:]
#> # Ordered by: StudyID, StudyMonth
#>    StudyID MonthYYYYMM StudyMonth Numerator Denominator Metric GroupCount
#>    <chr>         <dbl>      <dbl>     <dbl>       <dbl>  <dbl>      <dbl>
#>  1 AA-3         200311          1         0           1 0               1
#>  2 AA-3         200312          2         0           2 0               1
#>  3 AA-3         200401          3         1           5 0.2             3
#>  4 AA-3         200402          4         1          10 0.1             4
#>  5 AA-3         200403          5         1          13 0.0769          3
#>  6 AA-3         200404          6         6          16 0.375           3
#>  7 AA-3         200405          7         7          20 0.35            3
#>  8 AA-3         200406          8         7          23 0.304           3
#>  9 AA-3         200407          9        12          26 0.462           3
#> 10 AA-3         200408         10        17          29 0.586           3
#> # ℹ more rows
#> # ℹ 1 more variable: MetricID <chr>
Finally before plotting we need to collect the results into memory.
metrics_wf <- gsm.core::MakeWorkflowList(
  strNames = NULL,
  strPath = system.file("workflow/2_metrics", package = "gsm.studykri"),
  strPackage = NULL
)

dfMetrics <- gsm.reporting::MakeMetric(metrics_wf)


lCharts <- gsm.studykri::MakeCharts_StudyKRI(
  dfResults = collect(tblTransformed),
  dfBounds = collect(tblBounds),
  dfBoundsRef = collect(tblBoundsRef),
  dfMetrics = dfMetrics
)

lCharts
#> $`AA-1_kri0001`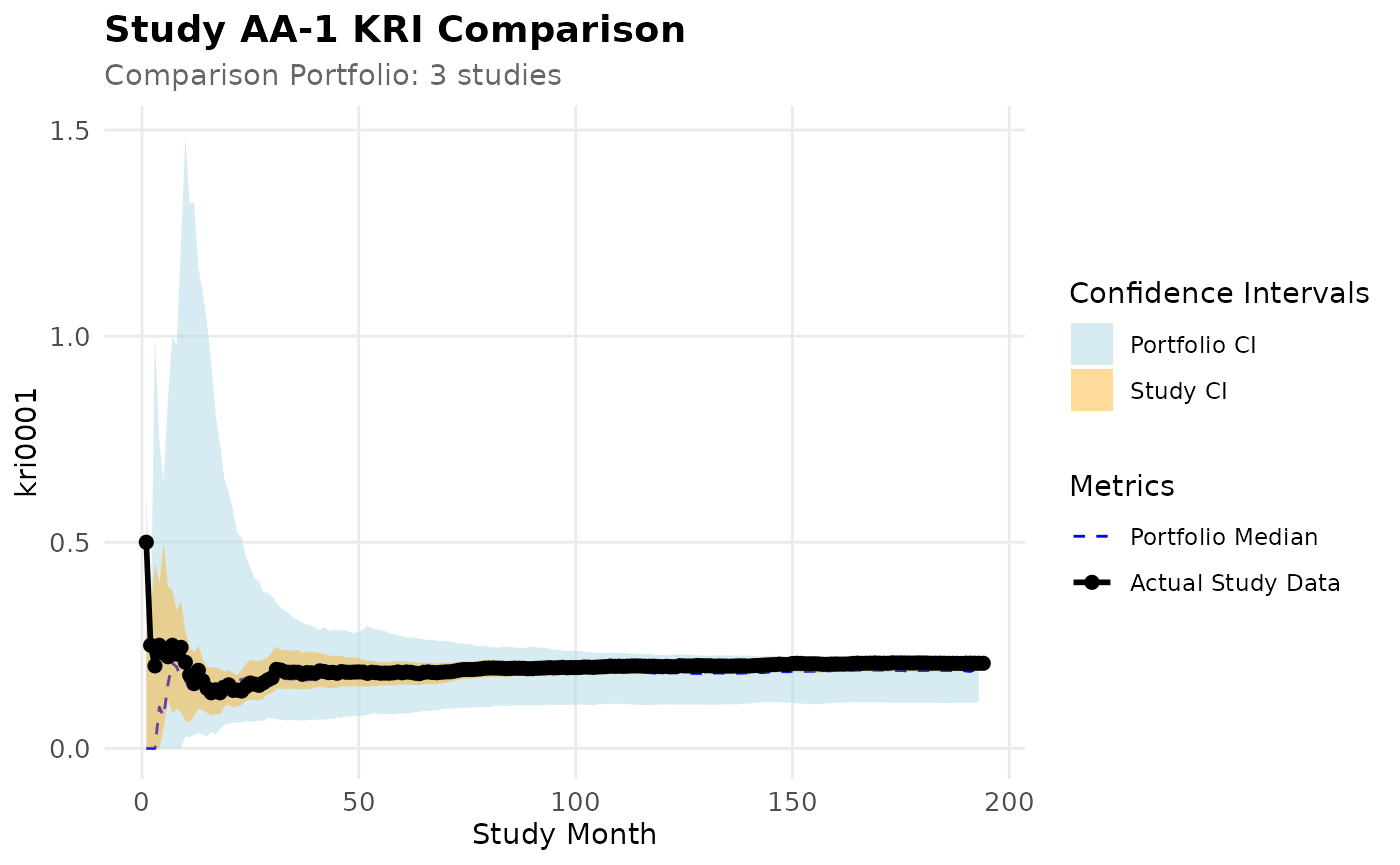
#>
#> $`AA-1_kri0002`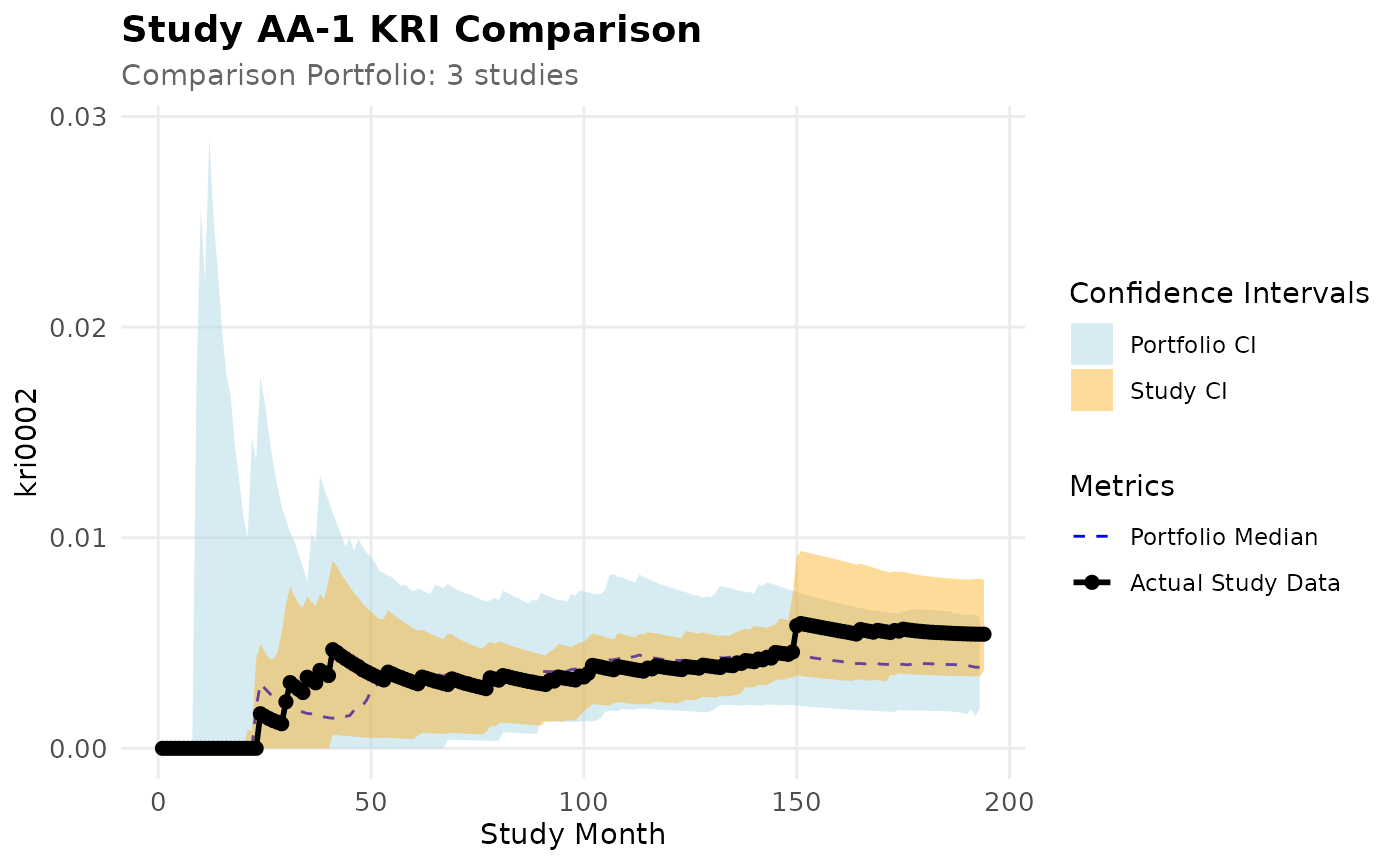
Using workflows
Unfortunately the data specfication checks from gsm.core will not work on lazy tables. We therefore need to skip the mapping workflow and ignore the warnings for the missing specifications.
We might also scrub some of the specifications from the yaml files to begin with.
lMapped <- list(
Mapped_AE = dbPortfolio$Raw_AE,
Mapped_Visit = dbPortfolio$Raw_VISIT,
Mapped_SUBJ = dbPortfolio$Raw_SUBJ %>%
filter(enrollyn == "Y"),
Mapped_StudyRef = tbl(con, "StudyRef")
)
metrics_wf <- gsm.core::MakeWorkflowList(
strNames = "kri0001.yaml",
strPath = system.file("workflow/2_metrics", package = "gsm.studykri"),
strPackage = NULL
)
lAnalyzed <- gsm.core::RunWorkflows(lWorkflows = metrics_wf, lData = lMapped)
#>
#> ── Running 1 Workflows ─────────────────────────────────────────────────────────
#>
#> ── Initializing `Analysis_kri0001` Workflow ────────────────────────────────────
#>
#> ── Checking data against spec
#> → All 2 data.frame(s) in the spec are present in the data: Mapped_AE, Mapped_SUBJ
#> Warning: Not all columns of Mapped_AE in the spec are in the expected format, improperly
#> formatted columns are: subjid
#> Not all columns of Mapped_AE in the spec are in the expected format, improperly
#> formatted columns are: aest_dt
#> Warning: Not all columns of Mapped_SUBJ in the spec are in the expected format,
#> improperly formatted columns are: subjid
#> Not all columns of Mapped_SUBJ in the spec are in the expected format,
#> improperly formatted columns are: invid
#> Not all columns of Mapped_SUBJ in the spec are in the expected format,
#> improperly formatted columns are: studyid
#> Not all columns of Mapped_SUBJ in the spec are in the expected format,
#> improperly formatted columns are: firstparticipantdate
#> Not all columns of Mapped_SUBJ in the spec are in the expected format,
#> improperly formatted columns are: lastparticipantdate
#> Warning: Not all specified columns in the spec are present in the data, missing columns
#> are: Mapped_AE$subjid
#> Not all specified columns in the spec are present in the data, missing columns
#> are: Mapped_AE$aest_dt
#> Not all specified columns in the spec are present in the data, missing columns
#> are: Mapped_SUBJ$subjid
#> Not all specified columns in the spec are present in the data, missing columns
#> are: Mapped_SUBJ$invid
#> Not all specified columns in the spec are present in the data, missing columns
#> are: Mapped_SUBJ$studyid
#> Not all specified columns in the spec are present in the data, missing columns
#> are: Mapped_SUBJ$firstparticipantdate
#> Not all specified columns in the spec are present in the data, missing columns
#> are: Mapped_SUBJ$lastparticipantdate
#>
#> ── Workflow Step 1 of 3: `gsm.studykri::Input_CountSiteByMonth` ──
#>
#> ── Evaluating 12 parameter(s) for `gsm.studykri::Input_CountSiteByMonth`
#> ✔ dfSubjects = Mapped_SUBJ: Passing lData$Mapped_SUBJ.
#> ✔ dfNumerator = Mapped_AE: Passing lData$Mapped_AE.
#> ✔ dfDenominator = Mapped_SUBJ: Passing lData$Mapped_SUBJ.
#> ℹ strStudyCol = studyid: No matching data found. Passing 'studyid' as a string.
#> ℹ strGroupCol = invid: No matching data found. Passing 'invid' as a string.
#> ✔ strGroupLevel = GroupLevel: Passing lMeta$GroupLevel.
#> ℹ strSubjectCol = subjid: No matching data found. Passing 'subjid' as a string.
#> ℹ strNumeratorDateCol = aest_dt: No matching data found. Passing 'aest_dt' as a string.
#> ℹ strDenominatorDateCol = firstparticipantdate: No matching data found. Passing 'firstparticipantdate' as a string.
#> ℹ strDenominatorEndDateCol = lastparticipantdate: No matching data found. Passing 'lastparticipantdate' as a string.
#> ✔ strDenominatorType = Denominator: Passing lMeta$Denominator.
#> ✔ nMinDenominator = AccrualThreshold: Passing lMeta$AccrualThreshold.
#>
#> ── Calling `gsm.studykri::Input_CountSiteByMonth`
#>
#> ── list of length 2 saved as `lData$Analysis_Input`.
#>
#> ── Workflow Step 2 of 3: `gsm.studykri::Transform_CumCount` ──
#>
#> ── Evaluating 2 parameter(s) for `gsm.studykri::Transform_CumCount`
#> ✔ dfInput = Analysis_Input: Passing lData$Analysis_Input.
#> ℹ vBy = StudyID: No matching data found. Passing 'StudyID' as a string.
#>
#> ── Calling `gsm.studykri::Transform_CumCount`
#>
#> ── list of length 2 saved as `lData$Analysis_Transformed`.
#>
#> ── Workflow Step 3 of 3: `list` ──
#>
#> ── Evaluating 3 parameter(s) for `list`
#> ✔ ID = ID: Passing lMeta$ID.
#> ✔ Analysis_Input = Analysis_Input: Passing lData$Analysis_Input.
#> ✔ Analysis_Transformed = Analysis_Transformed: Passing lData$Analysis_Transformed.
#>
#> ── Calling `list`
#>
#> ── list of length 3 saved as `lData$lAnalysis`.
#>
#> ── Returning results from final step: list of length 3`. ──
#>
#> ── Completed `Analysis_kri0001` Workflow ───────────────────────────────────────
reporting_wf <- gsm.core::MakeWorkflowList(
strNames = c("Bounds", "BoundsRef", "Input", "Join", "Metrics", "Results"),
strPath = system.file("workflow/3_reporting", package = "gsm.studykri")
)
reporting_wf$BoundsRef$meta$BootstrapReps <- 100
reporting_wf$Bounds$meta$BootstrapReps <- 100
lReporting <- gsm.core::RunWorkflows(
lWorkflows = reporting_wf,
lData = c(
lMapped,
list(
lAnalyzed = lAnalyzed,
lWorkflows = metrics_wf
)
)
)
#>
#> ── Running 6 Workflows ─────────────────────────────────────────────────────────
#>
#> ── Initializing `Reporting_Results` Workflow ───────────────────────────────────
#>
#> ── No spec found in workflow. Proceeding without checking data.
#>
#> ── Workflow Step 1 of 1: `gsm.studykri::BindResults` ──
#>
#> ── Evaluating 2 parameter(s) for `gsm.studykri::BindResults`
#> ✔ lAnalysis = lAnalyzed: Passing lData$lAnalyzed.
#> ℹ strName = Analysis_Transformed: No matching data found. Passing 'Analysis_Transformed' as a string.
#>
#> ── Calling `gsm.studykri::BindResults`
#>
#> ── list of length 2 saved as `lData$lResults`.
#>
#> ── Returning results from final step: list of length 2`. ──
#>
#> ── Completed `Reporting_Results` Workflow ──────────────────────────────────────
#>
#> ── Initializing `Reporting_Input` Workflow ─────────────────────────────────────
#>
#> ── No spec found in workflow. Proceeding without checking data.
#>
#> ── Workflow Step 1 of 1: `gsm.studykri::BindResults` ──
#>
#> ── Evaluating 2 parameter(s) for `gsm.studykri::BindResults`
#> ✔ lAnalysis = lAnalyzed: Passing lData$lAnalyzed.
#> ℹ strName = Analysis_Input: No matching data found. Passing 'Analysis_Input' as a string.
#>
#> ── Calling `gsm.studykri::BindResults`
#>
#> ── list of length 2 saved as `lData$Reporting_Input`.
#>
#> ── Returning results from final step: list of length 2`. ──
#>
#> ── Completed `Reporting_Input` Workflow ────────────────────────────────────────
#>
#> ── Initializing `Reporting_Metrics` Workflow ───────────────────────────────────
#>
#> ── No spec found in workflow. Proceeding without checking data.
#>
#> ── Workflow Step 1 of 1: `gsm.reporting::MakeMetric` ──
#>
#> ── Evaluating 1 parameter(s) for `gsm.reporting::MakeMetric`
#> ✔ lWorkflows = lWorkflows: Passing lData$lWorkflows.
#>
#> ── Calling `gsm.reporting::MakeMetric`
#>
#> ── 1x16 data.frame saved as `lData$Reporting_Metrics`.
#>
#> ── Returning results from final step: 1x16 data.frame`. ──
#>
#> ── Completed `Reporting_Metrics` Workflow ──────────────────────────────────────
#>
#> ── Initializing `Reporting_Join` Workflow ──────────────────────────────────────
#>
#> ── Checking data against spec
#> → All 2 data.frame(s) in the spec are present in the data: Reporting_Input, Reporting_Metrics
#> Warning: Not all columns of Reporting_Input in the spec are in the expected format,
#> improperly formatted columns are: MetricID
#> Not all columns of Reporting_Input in the spec are in the expected format,
#> improperly formatted columns are: GroupID
#> Not all columns of Reporting_Input in the spec are in the expected format,
#> improperly formatted columns are: GroupLevel
#> Not all columns of Reporting_Input in the spec are in the expected format,
#> improperly formatted columns are: Numerator
#> Not all columns of Reporting_Input in the spec are in the expected format,
#> improperly formatted columns are: Denominator
#> Not all columns of Reporting_Input in the spec are in the expected format,
#> improperly formatted columns are: StudyID
#> Not all columns of Reporting_Input in the spec are in the expected format,
#> improperly formatted columns are: MonthYYYYMM
#> Warning: Not all specified columns in the spec are present in the data, missing columns
#> are: Reporting_Input$MetricID
#> Not all specified columns in the spec are present in the data, missing columns
#> are: Reporting_Input$GroupID
#> Not all specified columns in the spec are present in the data, missing columns
#> are: Reporting_Input$GroupLevel
#> Not all specified columns in the spec are present in the data, missing columns
#> are: Reporting_Input$Numerator
#> Not all specified columns in the spec are present in the data, missing columns
#> are: Reporting_Input$Denominator
#> Not all specified columns in the spec are present in the data, missing columns
#> are: Reporting_Input$StudyID
#> Not all specified columns in the spec are present in the data, missing columns
#> are: Reporting_Input$MonthYYYYMM
#>
#> ── Workflow Step 1 of 1: `gsm.studykri::JoinKRIByDenominator` ──
#>
#> ── Evaluating 2 parameter(s) for `gsm.studykri::JoinKRIByDenominator`
#> ✔ dfInput = Reporting_Input: Passing lData$Reporting_Input.
#> ✔ dfMetrics = Reporting_Metrics: Passing lData$Reporting_Metrics.
#>
#> ── Calling `gsm.studykri::JoinKRIByDenominator`
#>
#> ── list of length 1 saved as `lData$Joined_Analysis_Input`.
#>
#> ── Returning results from final step: list of length 1`. ──
#>
#> ── Completed `Reporting_Join` Workflow ─────────────────────────────────────────
#>
#> ── Initializing `Reporting_Bounds` Workflow ────────────────────────────────────
#>
#> ── Checking data against spec
#> → All 2 data.frame(s) in the spec are present in the data: Reporting_Join, Mapped_StudyRef
#> → All specified columns in Mapped_StudyRef are in the expected format
#> Warning: Not all specified columns in the spec are present in the data, missing columns
#> are: Mapped_StudyRef$study
#> Not all specified columns in the spec are present in the data, missing columns
#> are: Mapped_StudyRef$studyref
#>
#> ── Workflow Step 1 of 3: `gsm.studykri::ParseFunction` ──
#>
#> ── Evaluating 1 parameter(s) for `gsm.studykri::ParseFunction`
#> ℹ strFunction = gsm.studykri::Analyze_StudyKRI_PredictBounds: No matching data found. Passing 'gsm.studykri::Analyze_StudyKRI_PredictBounds' as a string.
#>
#> ── Calling `gsm.studykri::ParseFunction`
#>
#> ── closure of length 1 saved as `lData$PredictBounds_Func`.
#>
#> ── Workflow Step 2 of 3: `purrr::map` ──
#>
#> ── Evaluating 5 parameter(s) for `purrr::map`
#> ✔ .x = Reporting_Join: Passing lData$Reporting_Join.
#> ✔ .f = PredictBounds_Func: Passing lData$PredictBounds_Func.
#> ✔ dfStudyRef = Mapped_StudyRef: Passing lData$Mapped_StudyRef.
#> ✔ nBootstrapReps = BootstrapReps: Passing lMeta$BootstrapReps.
#> ✔ nConfLevel = Threshold: Passing lMeta$Threshold.
#>
#> ── Calling `purrr::map`
#>
#> ── list of length 1 saved as `lData$Analysis_Bounds_Wide`.
#>
#> ── Workflow Step 3 of 3: `gsm.studykri::Transform_Long` ──
#>
#> ── Evaluating 1 parameter(s) for `gsm.studykri::Transform_Long`
#> ✔ lWide = Analysis_Bounds_Wide: Passing lData$Analysis_Bounds_Wide.
#>
#> ── Calling `gsm.studykri::Transform_Long`
#>
#> ── list of length 2 saved as `lData$Reporting_Bounds`.
#>
#> ── Returning results from final step: list of length 2`. ──
#>
#> ── Completed `Reporting_Bounds` Workflow ───────────────────────────────────────
#>
#> ── Initializing `Reporting_BoundsRef` Workflow ─────────────────────────────────
#>
#> ── Checking data against spec
#> → All 2 data.frame(s) in the spec are present in the data: Reporting_Join, Mapped_StudyRef
#> → All specified columns in Mapped_StudyRef are in the expected format
#> Warning: Not all specified columns in the spec are present in the data, missing columns
#> are: Mapped_StudyRef$study
#> Not all specified columns in the spec are present in the data, missing columns
#> are: Mapped_StudyRef$studyref
#>
#> ── Workflow Step 1 of 3: `gsm.studykri::ParseFunction` ──
#>
#> ── Evaluating 1 parameter(s) for `gsm.studykri::ParseFunction`
#> ℹ strFunction = gsm.studykri::Analyze_StudyKRI_PredictBoundsRef: No matching data found. Passing 'gsm.studykri::Analyze_StudyKRI_PredictBoundsRef' as a string.
#>
#> ── Calling `gsm.studykri::ParseFunction`
#>
#> ── closure of length 1 saved as `lData$PredictBoundsRef_Func`.
#>
#> ── Workflow Step 2 of 3: `purrr::map` ──
#>
#> ── Evaluating 6 parameter(s) for `purrr::map`
#> ✔ .x = Reporting_Join: Passing lData$Reporting_Join.
#> ✔ .f = PredictBoundsRef_Func: Passing lData$PredictBoundsRef_Func.
#> ✔ dfStudyRef = Mapped_StudyRef: Passing lData$Mapped_StudyRef.
#> ✔ nBootstrapReps = BootstrapReps: Passing lMeta$BootstrapReps.
#> ✔ nConfLevel = Threshold: Passing lMeta$Threshold.
#> ✔ bMixStudies = bMixStudies: Passing lMeta$bMixStudies.
#>
#> ── Calling `purrr::map`
#> Calculated minimum group count: 73
#>
#> ── list of length 1 saved as `lData$Analysis_BoundsRef_Wide`.
#>
#> ── Workflow Step 3 of 3: `gsm.studykri::Transform_Long` ──
#>
#> ── Evaluating 1 parameter(s) for `gsm.studykri::Transform_Long`
#> ✔ lWide = Analysis_BoundsRef_Wide: Passing lData$Analysis_BoundsRef_Wide.
#>
#> ── Calling `gsm.studykri::Transform_Long`
#>
#> ── list of length 2 saved as `lData$Reporting_BoundsRef`.
#>
#> ── Returning results from final step: list of length 2`. ──
#>
#> ── Completed `Reporting_BoundsRef` Workflow ────────────────────────────────────
lReporting
#> $Reporting_Results
#> # Source: SQL [?? x 9]
#> # Database: DuckDB 1.5.1 [unknown@Linux 6.17.0-1008-azure:R 4.5.3/:memory:]
#> # Ordered by: StudyID, StudyMonth
#> StudyID MonthYYYYMM StudyMonth Numerator Denominator Metric GroupCount
#> <chr> <dbl> <dbl> <dbl> <dbl> <dbl> <dbl>
#> 1 AA-3 200410 1 22 65 0.338 5
#> 2 AA-3 200411 2 22 209 0.105 5
#> 3 AA-3 200412 3 25 333 0.0751 4
#> 4 AA-3 200501 4 26 457 0.0569 4
#> 5 AA-3 200502 5 26 581 0.0448 7
#> 6 AA-3 200503 6 27 873 0.0309 10
#> 7 AA-3 200504 7 32 1259 0.0254 13
#> 8 AA-3 200505 8 35 1693 0.0207 13
#> 9 AA-3 200506 9 39 2113 0.0185 13
#> 10 AA-3 200507 10 41 2559 0.0160 14
#> # ℹ more rows
#> # ℹ 2 more variables: MetricID <chr>, SnapshotDate <date>
#>
#> $Reporting_Input
#> # Source: SQL [?? x 10]
#> # Database: DuckDB 1.5.1 [unknown@Linux 6.17.0-1008-azure:R 4.5.3/:memory:]
#> GroupID GroupLevel Numerator Denominator Metric StudyID MonthYYYYMM
#> <chr> <chr> <dbl> <dbl> <dbl> <chr> <dbl>
#> 1 AA-1_0X041 Site 1 60 0.0167 AA-1 200906
#> 2 AA-1_0X041 Site 3 16 0.188 AA-1 200909
#> 3 AA-1_0X035 Site 1 31 0.0323 AA-1 200407
#> 4 AA-1_0X035 Site 1 30 0.0333 AA-1 200404
#> 5 AA-1_0X035 Site 1 31 0.0323 AA-1 200512
#> 6 AA-1_0X035 Site 1 31 0.0323 AA-1 200408
#> 7 AA-1_0X162 Site 1 31 0.0323 AA-1 201805
#> 8 AA-1_0X069 Site 1 31 0.0323 AA-1 200608
#> 9 AA-1_0X023 Site 1 93 0.0108 AA-1 201112
#> 10 AA-1_0X161 Site 1 30 0.0333 AA-1 201106
#> # ℹ more rows
#> # ℹ 3 more variables: DenominatorType <chr>, MetricID <chr>,
#> # SnapshotDate <date>
#>
#> $Reporting_Metrics
#> # A tibble: 1 × 16
#> Type ID GroupLevel Abbreviation Metric Numerator Denominator Model Score
#> <chr> <chr> <chr> <chr> <chr> <chr> <chr> <chr> <chr>
#> 1 Analys… kri0… Site AE Adver… Adverse … Days on St… Boot… Boot…
#> # ℹ 7 more variables: AnalysisType <chr>, Threshold <dbl>,
#> # AccrualThreshold <int>, AccrualMetric <chr>, BootstrapReps <int>,
#> # Priority <dbl>, MetricID <chr>
#>
#> $Reporting_Join
#> $Reporting_Join$`Days on Study`
#> # Source: SQL [?? x 6]
#> # Database: DuckDB 1.5.1 [unknown@Linux 6.17.0-1008-azure:R 4.5.3/:memory:]
#> GroupID GroupLevel Denominator StudyID MonthYYYYMM Numerator_Analysis_kr…¹
#> <chr> <chr> <dbl> <chr> <dbl> <dbl>
#> 1 AA-1_0X041 Site 60 AA-1 200906 1
#> 2 AA-1_0X035 Site 31 AA-1 200408 1
#> 3 AA-1_0X162 Site 31 AA-1 201805 1
#> 4 AA-1_0X069 Site 31 AA-1 200608 1
#> 5 AA-1_0X161 Site 30 AA-1 201106 1
#> 6 AA-1_0X154 Site 31 AA-1 201008 1
#> 7 AA-1_0X153 Site 31 AA-1 201703 1
#> 8 AA-1_0X093 Site 30 AA-1 201206 1
#> 9 AA-1_0X154 Site 29 AA-1 201602 1
#> 10 AA-1_0X052 Site 120 AA-1 200806 1
#> # ℹ more rows
#> # ℹ abbreviated name: ¹Numerator_Analysis_kri0001
#>
#>
#> $Reporting_Bounds
#> # Source: SQL [?? x 8]
#> # Database: DuckDB 1.5.1 [unknown@Linux 6.17.0-1008-azure:R 4.5.3/:memory:]
#> # Ordered by: StudyID, StudyMonth
#> MetricID DenominatorType StudyID StudyMonth BootstrapCount Median Lower
#> <chr> <chr> <chr> <dbl> <int> <dbl> <dbl>
#> 1 Analysis_k… Days on Study AA-1 1 100 0.0411 0.02
#> 2 Analysis_k… Days on Study AA-1 7 100 0.00825 0.00475
#> 3 Analysis_k… Days on Study AA-1 8 100 0.00692 0.00372
#> 4 Analysis_k… Days on Study AA-1 13 100 0.00572 0.00358
#> 5 Analysis_k… Days on Study AA-1 19 100 0.00573 0.00389
#> 6 Analysis_k… Days on Study AA-1 21 100 0.00526 0.00382
#> 7 Analysis_k… Days on Study AA-1 25 100 0.00632 0.00467
#> 8 Analysis_k… Days on Study AA-1 27 100 0.00604 0.00442
#> 9 Analysis_k… Days on Study AA-1 46 100 0.00564 0.00468
#> 10 Analysis_k… Days on Study AA-1 48 100 0.00563 0.00461
#> # ℹ more rows
#> # ℹ 1 more variable: Upper <dbl>
#>
#> $Reporting_BoundsRef
#> # Source: SQL [?? x 11]
#> # Database: DuckDB 1.5.1 [unknown@Linux 6.17.0-1008-azure:R 4.5.3/:memory:]
#> # Ordered by: StudyMonth
#> MetricID DenominatorType StudyMonth BootstrapCount GroupCount StudyCount
#> <chr> <chr> <dbl> <int> <dbl> <int>
#> 1 Analysis_kri… Days on Study 165 100 73 3
#> 2 Analysis_kri… Days on Study 166 100 73 3
#> 3 Analysis_kri… Days on Study 168 100 73 3
#> 4 Analysis_kri… Days on Study 172 100 73 3
#> 5 Analysis_kri… Days on Study 177 100 73 3
#> 6 Analysis_kri… Days on Study 179 100 73 3
#> 7 Analysis_kri… Days on Study 180 100 73 3
#> 8 Analysis_kri… Days on Study 5 100 73 3
#> 9 Analysis_kri… Days on Study 9 100 73 3
#> 10 Analysis_kri… Days on Study 11 100 73 3
#> # ℹ more rows
#> # ℹ 5 more variables: StudyID <chr>, StudyRefID <chr>, Median <dbl>,
#> # Lower <dbl>, Upper <dbl>Next we collect the data and create the charts.
lCharts <- gsm.studykri::MakeCharts_StudyKRI(
  dfResults = collect(lReporting$Reporting_Results),
  dfBounds = collect(lReporting$Reporting_Bounds),
  dfBoundsRef = collect(lReporting$Reporting_BoundsRef),
  dfMetrics = lReporting$Reporting_Metrics
)

lCharts
#> $`AA-1_Analysis_kri0001`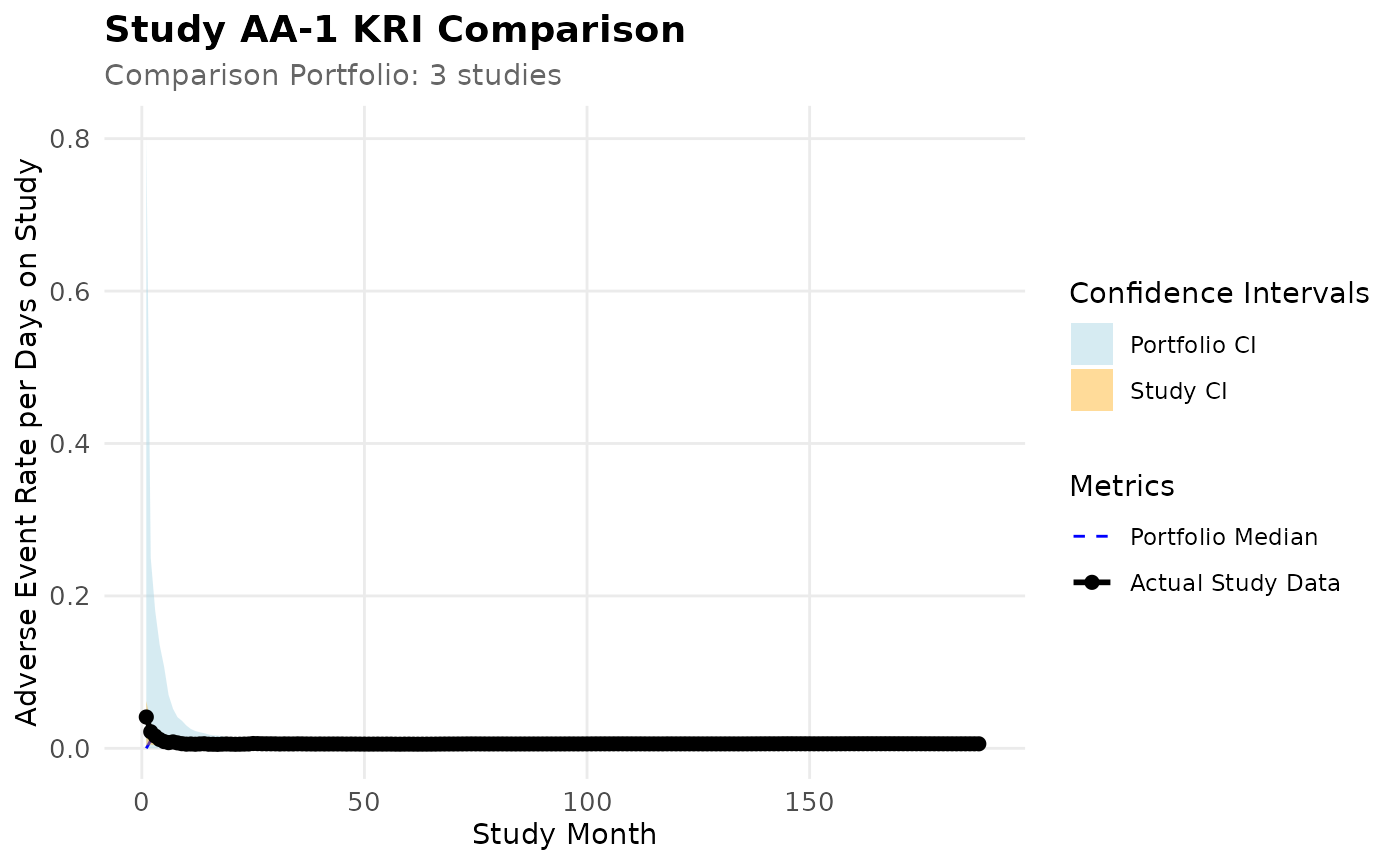
Using Snowflake or Other Integer Random Backends
If you’re using Snowflake or another database that returns large
integers for RANDOM(), add the
vDbIntRandomRange parameter to your bootstrap function
calls:
# For Snowflake: specify signed 64-bit integer range
Bounds_Wide_Snowflake <- purrr::map(
  lJoined, ~ Analyze_StudyKRI_PredictBounds(
    .,
    dfStudyRef = tblStudyRef,
    tblBootstrapReps = tblRep,
    tblMonthSequence = tblMonths,
    vDbIntRandomRange = c(-9223372036854775808, 9223372036854775807)
  )
)

BoundsRef_Wide_Snowflake <- purrr::map(
  lJoined, ~ Analyze_StudyKRI_PredictBoundsRef(
    .,
    dfStudyRef = tblStudyRef,
    tblBootstrapReps = tblRep,
    tblMonthSequence = tblMonths,
    vDbIntRandomRange = c(-9223372036854775808, 9223372036854775807)
  )
)
The vDbIntRandomRange parameter should be added to:
Analyze_StudyKRI_PredictBounds()Analyze_StudyKRI_PredictBoundsRef()Analyze_StudyKRI_PredictBoundsRefSet()
This ensures that random values are properly normalized regardless of the database backend’s random number generation method.
Performance Optimization for Database Backends
Optimization Strategy 1: Pass nMinGroups via StudyRef
The most impactful optimization is avoiding the collection of the full dataset to calculate minimum group counts. By pre-calculating and including a MinGroups column in your StudyRef table, you can avoid materializing potentially millions of rows.
How to calculate MinGroups:
For each target study in your StudyRef mapping, calculate the minimum group count across all its reference studies:
-- Example: Calculate MinGroups for each target-reference set
WITH GroupCounts AS (
  SELECT
    StudyID,
    COUNT(DISTINCT GroupID) AS group_count
  FROM Analysis_Input
  WHERE StudyID IN ('REF_STUDY_1', 'REF_STUDY_2', 'REF_STUDY_3')
  GROUP BY StudyID
)
SELECT
  'TARGET_STUDY' AS studyid,
  'REF_STUDY_1' AS studyrefid,  -- repeat for each reference
  MIN(group_count) AS MinGroups
FROM GroupCounts;
Then include it in your StudyRef table:
The StudyRef.yaml workflow selects only the required
studyid and studyrefid columns. To use the
MinGroups optimization, you have two options:
Option 1: Add MinGroups directly to your StudyRef data
# Create Raw_StudyRef with MinGroups column
dfStudyRef <- tibble(
  studyid = "AA-1",
  studyrefid = c("AA-2", "AA-3", "AA-4"),
  MinGroups = 8 # Pre-calculated minimum across reference studies
)

# Write to database
DBI::dbWriteTable(con, "StudyRef", dfStudyRef, overwrite = TRUE)
tblStudyRef <- tbl(con, "StudyRef")

# Use in analysis - MinGroups will be automatically detected and used
BoundsRef_Optimized <- Analyze_StudyKRI_PredictBoundsRef(
  dfInput = tblInput,
  dfStudyRef = tblStudyRef,
  tblBootstrapReps = tblRep,
  tblMonthSequence = tblMonths
)
Option 2: Use a custom mapping query
If you need to transform the column name, create a custom StudyRef.yaml workflow:
steps:
  - output: Mapped_StudyRef
    name: gsm.core::RunQuery
    params:
      df: Raw_StudyRef
      strQuery: "SELECT studyid AS study, studyrefid AS studyref, mingroups AS MinGroups FROM df"
Option 3: Use a custom column name
dfStudyRef_Custom <- tibble(
  studyid = "AA-1",
  studyrefid = c("AA-2", "AA-3", "AA-4"),
  min_grp_cnt = 8
)

BoundsRef_Custom <- Analyze_StudyKRI_PredictBoundsRef(
  dfInput = tblInput,
  dfStudyRef = tblStudyRef_Custom,
  strMinGroupsCol = "min_grp_cnt", # Specify custom column name
  tblBootstrapReps = tblRep,
  tblMonthSequence = tblMonths
)
Optimization Strategy 2: Skip Validation Checks
The JoinKRIByDenominator() function performs several
validation checks that require collect() operations. When
confident in data quality, skip these:
lJoined <- JoinKRIByDenominator(
  tblInput,
  dfMetrics,
  bSkipValidation = TRUE # Disable validation collect() operations
)
Optimization Strategy 3: Pre-generate Temporary Tables
Provide pre-generated bootstrap replicates and month sequences to avoid repeated temp table creation:
# Create once, reuse many times
dfRep <- tibble(BootstrapRep = seq(1, 1000))
dfMonths <- tibble(
  YYYY = seq(2003, 2020)
) %>%
  cross_join(tibble(MM = seq(1, 12))) %>%
  mutate(MonthYYYYMM = YYYY * 100 + MM) %>%
  select(MonthYYYYMM)

DBI::dbWriteTable(con, "Rep", dfRep)
DBI::dbWriteTable(con, "Months", dfMonths)

tblRep <- tbl(con, "Rep")
tblMonths <- tbl(con, "Months")

# Pass to all functions
Bounds <- Analyze_StudyKRI_PredictBounds(
  dfInput,
  tblBootstrapReps = tblRep,
  tblMonthSequence = tblMonths
)
Optimization Strategy 4: Use funCompute to Cache Intermediate Results
When working with large database queries, you can use the
funCompute parameter to cache intermediate results in the
database. This can significantly improve performance by materializing
temporary tables rather than re-executing complex queries.
The funCompute parameter accepts a function that will be
applied to intermediate database results. The most common use case is
dplyr::compute():
# Cache intermediate results during bootstrap calculations
BoundsRef_Cached <- Analyze_StudyKRI_PredictBoundsRef(
  dfInput = tblInput,
  dfStudyRef = tblStudyRef,
  nBootstrapReps = 1000,
  tblBootstrapReps = tblRep,
  tblMonthSequence = tblMonths,
  funCompute = dplyr::compute # Cache intermediate results
)
You can also provide a custom function for more control:
# Custom compute function - let dplyr auto-generate unique names
# (Important: don't specify fixed names as funCompute may be called multiple times)
custom_cache <- function(x) {
  dplyr::compute(x, temporary = TRUE)
}

BoundsRef_Custom <- Analyze_StudyKRI_PredictBoundsRef(
  dfInput = tblInput,
  dfStudyRef = tblStudyRef,
  nBootstrapReps = 1000,
  funCompute = custom_cache
)
When to use funCompute:
- Complex queries that are re-used multiple times
- Very large datasets where materialization is faster than re-computation
- When database query optimizer struggles with complex lazy query plans
Performance trade-offs:
- Benefit: Avoids re-executing expensive queries; can reduce query complexity
- Cost: Requires database write permissions; creates temporary tables that use storage
Note: funCompute is primarily
beneficial for large datasets (millions of rows), complex multi-study
portfolios, or queries that are re-executed multiple times. For small
datasets or simple queries, the overhead of creating temporary tables
may outweigh benefits.
Best Practices Summary
-
Add MinGroups column to StudyRef (or use
strMinGroupsColparameter for custom names) for the biggest performance gain -
Use
bSkipValidation = TRUEinJoinKRIByDenominator()when data quality is assured -
Pre-generate temp tables
(
tblBootstrapReps,tblMonthSequence) to avoid repeated creation -
Use
funComputeto cache intermediate results when working with large datasets or complex queries