Visualize Study KRI with Confidence Intervals
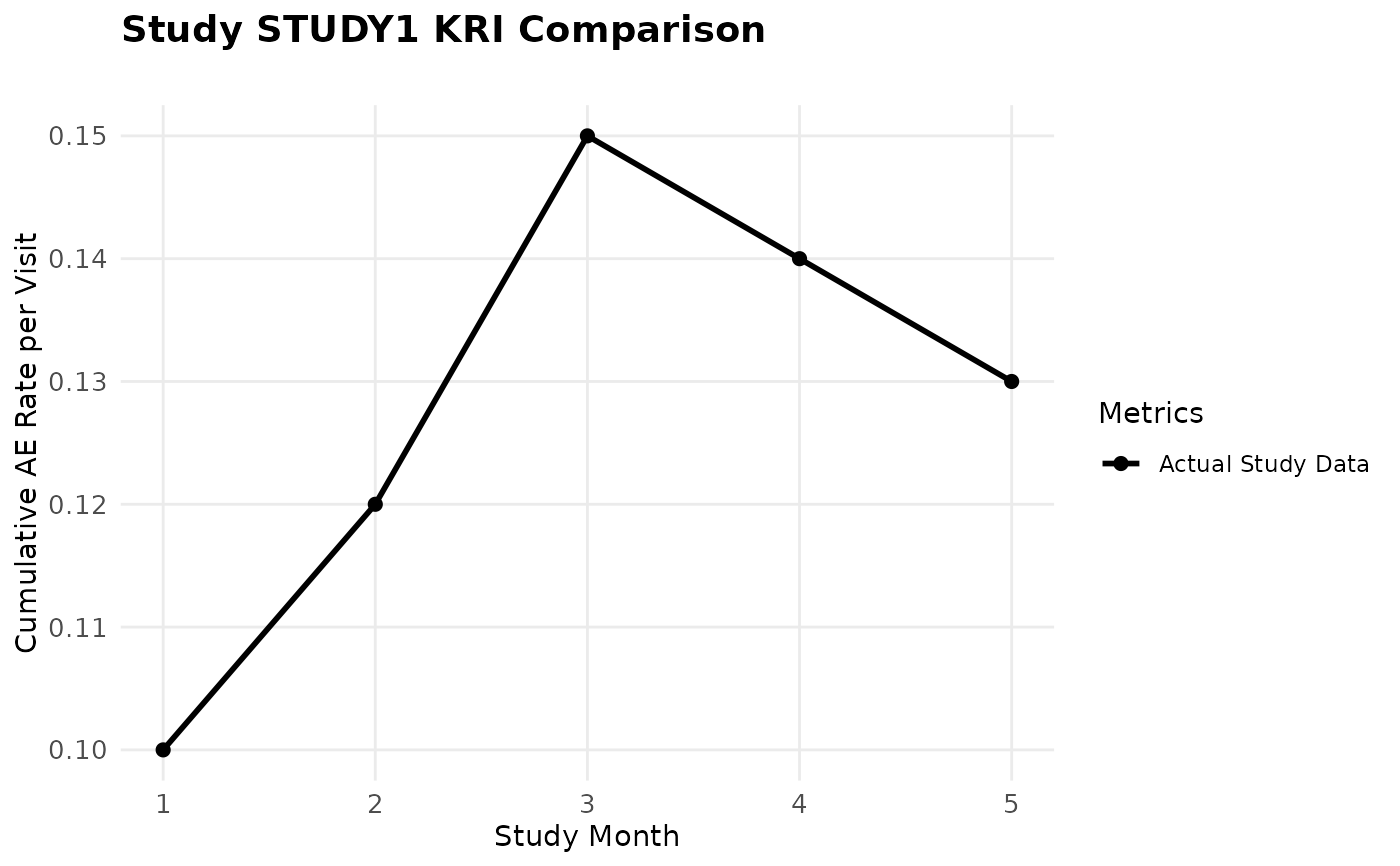
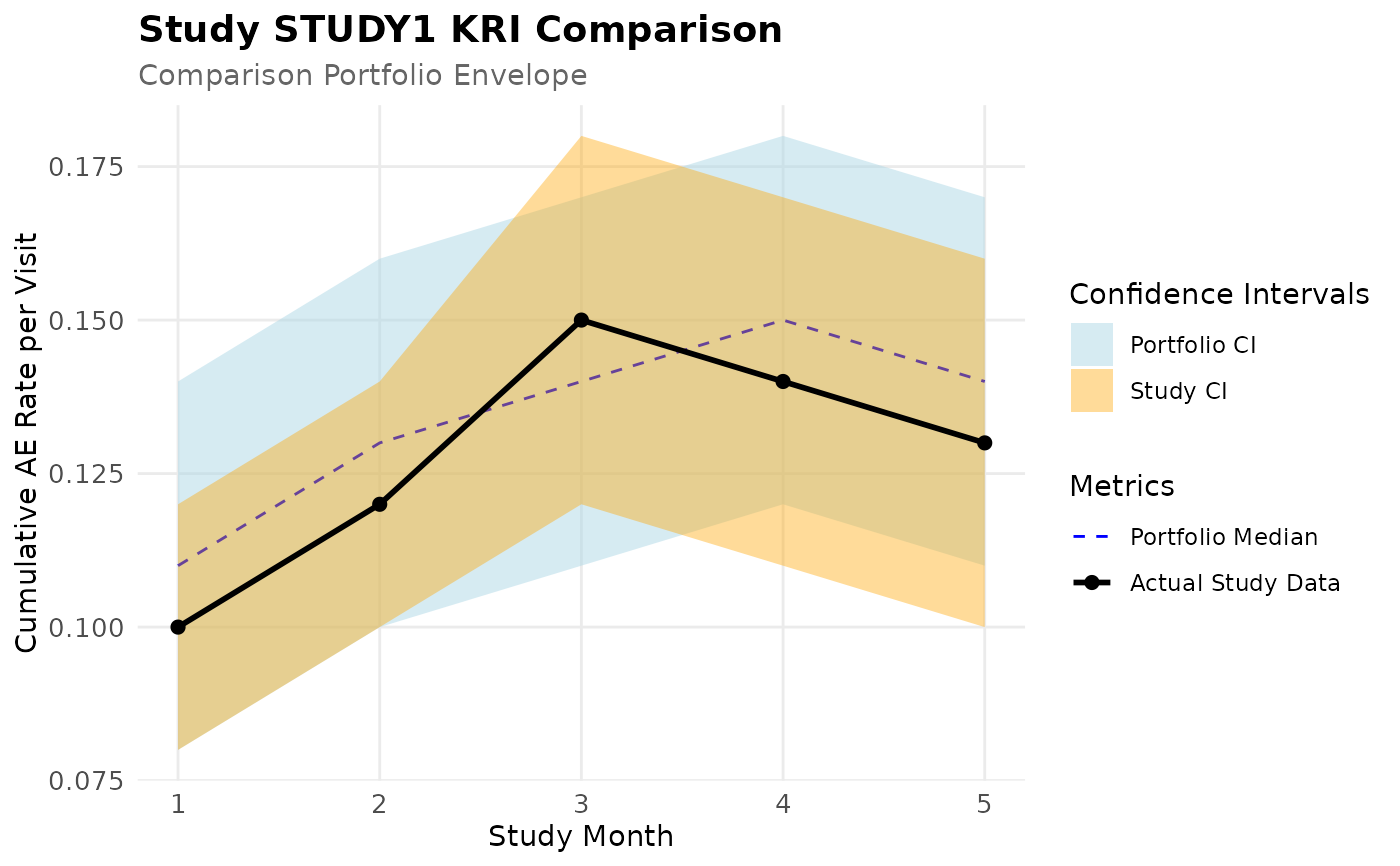
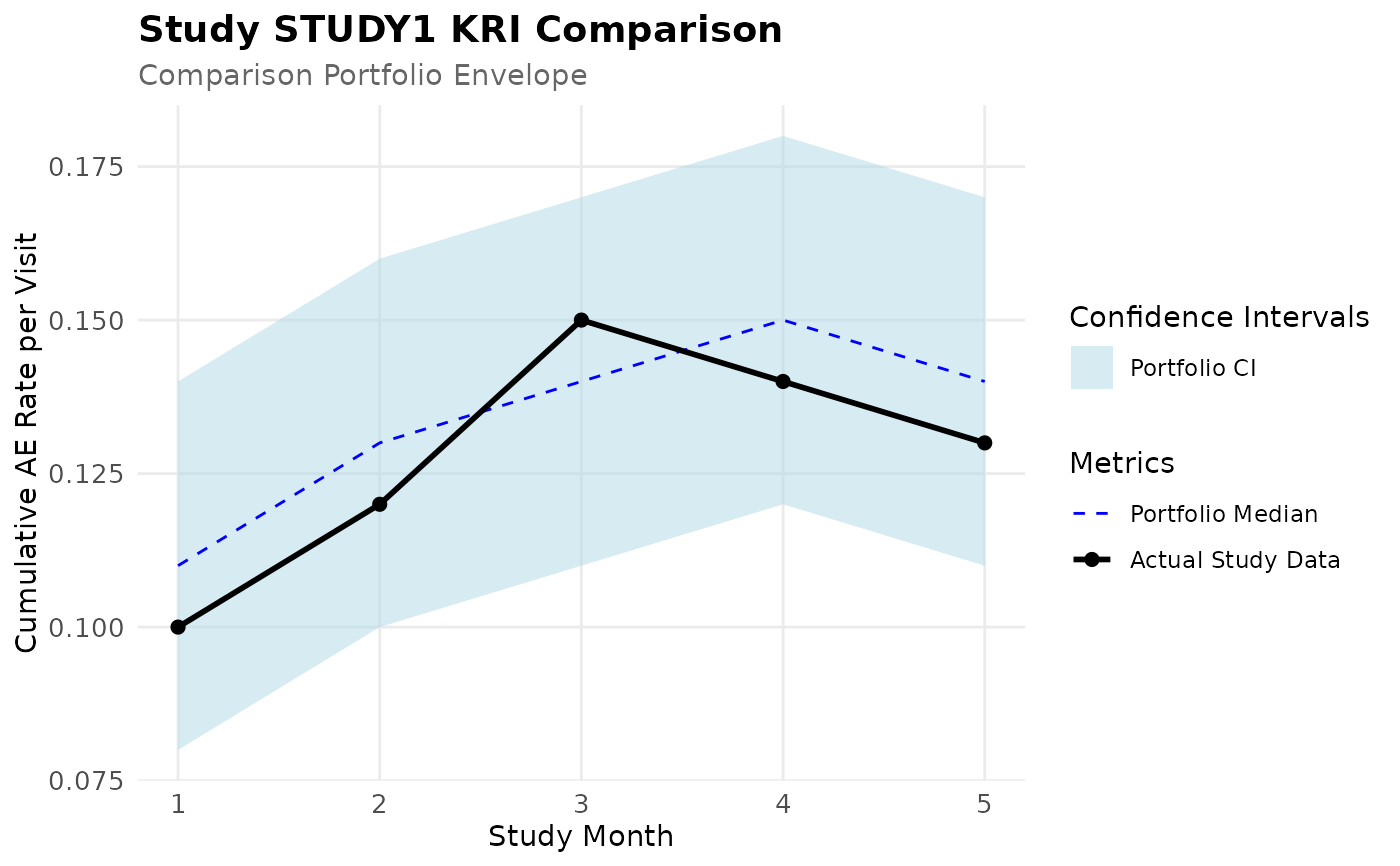
Visualize_StudyKRI.RdCreates a layered visualization comparing a study's KRI metric against portfolio confidence intervals. The plot shows:
Portfolio/comparison group confidence intervals (light blue ribbon)
Individual study confidence intervals (orange ribbon, optional)
Actual study metric line (black line with points)
This visualization helps identify when a study's performance deviates from expected portfolio norms.
Usage
Visualize_StudyKRI(
  dfStudyKRI,
  dfBoundsRef = NULL,
  dfBounds = NULL,
  strStudyID,
  strStudyMonthCol = "StudyMonth",
  strMetricCol = "Metric",
  strMedianCol = "Median",
  strLowerCol = "Lower",
  strUpperCol = "Upper",
  nMaxMonth = NULL,
  strTitle = NULL,
  strSubtitle = NULL,
  strYlab = "Metric",
  strXlab = "Study Month",
  bLogY = FALSE
)
Arguments
- dfStudyKRI
data.frame. Actual study-level metric data from
Transform_CumCount. Must contain columns specified bystrStudyMonthColandstrMetricCol. If aStudyIDcolumn exists, data will be automatically filtered tostrStudyID.- dfBoundsRef
data.frame or NULL. Portfolio/comparison group confidence intervals from
Analyze_StudyKRI_PredictBoundsReforTransform_Long(optional, default: NULL). If provided, must contain:StudyMonthand columns specified bystrMedianCol,strLowerCol,strUpperCol. If NULL, plot will show only study data without reference comparison.- dfBounds
data.frame or NULL. Individual study confidence intervals from
Analyze_StudyKRI_PredictBoundsorTransform_Long(optional). If aStudyIDcolumn exists, data will be automatically filtered tostrStudyID. If provided, must contain:StudyMonthand columns specified bystrMedianCol,strLowerCol,strUpperCol.- strStudyID
character. Study ID to filter data and display in title/subtitle.
- strStudyMonthCol
character. Column name for study month (default: "StudyMonth").
- strMetricCol
character. Column name for metric (default: "Metric").
- strMedianCol
character. Column name for median in bounds dataframes (default: "Median").
- strLowerCol
character. Column name for lower bound (default: "Lower").
- strUpperCol
character. Column name for upper bound (default: "Upper").
- nMaxMonth
integer or NULL. Maximum study month to display. If NULL (default), shows all available months.
- strTitle
character or NULL. Plot title. If NULL, generates default title.
- strSubtitle
character or NULL. Plot subtitle. If NULL, generates default showing comparison study count.
- strYlab
character. Y-axis label (default: "Metric").
- strXlab
character. X-axis label (default: "Study Month").
- bLogY
logical. If TRUE, apply logarithmic scale to y-axis (default: FALSE).
Examples
# Example 1: Using Transform_Long output (default column names)
dfStudyKRI <- data.frame(
StudyID = rep("STUDY1", 5),
StudyMonth = 1:5,
Metric = c(0.10, 0.12, 0.15, 0.14, 0.13)
)
dfBoundsRef <- data.frame(
StudyMonth = 1:5,
Median = c(0.11, 0.13, 0.14, 0.15, 0.14),
Lower = c(0.08, 0.10, 0.11, 0.12, 0.11),
Upper = c(0.14, 0.16, 0.17, 0.18, 0.17)
)
dfBounds <- data.frame(
StudyMonth = 1:5,
Median = c(0.10, 0.12, 0.15, 0.14, 0.13),
Lower = c(0.08, 0.10, 0.12, 0.11, 0.10),
Upper = c(0.12, 0.14, 0.18, 0.17, 0.16)
)
# Plot with reference bounds (uses default column names)
p1 <- Visualize_StudyKRI(
dfStudyKRI = dfStudyKRI,
dfBoundsRef = dfBoundsRef,
dfBounds = dfBounds,
strStudyID = "STUDY1",
strYlab = "Cumulative AE Rate per Visit"
)
p1
 # Example 2: Backward compatibility with old column names
dfBoundsRef_old <- data.frame(
StudyMonth = 1:5,
MedianMetric = c(0.11, 0.13, 0.14, 0.15, 0.14),
LowerBound = c(0.08, 0.10, 0.11, 0.12, 0.11),
UpperBound = c(0.14, 0.16, 0.17, 0.18, 0.17)
)
p2 <- Visualize_StudyKRI(
dfStudyKRI = dfStudyKRI,
dfBoundsRef = dfBoundsRef_old,
strStudyID = "STUDY1",
strMedianCol = "MedianMetric",
strLowerCol = "LowerBound",
strUpperCol = "UpperBound",
strYlab = "Cumulative AE Rate per Visit"
)
p2
# Example 2: Backward compatibility with old column names
dfBoundsRef_old <- data.frame(
StudyMonth = 1:5,
MedianMetric = c(0.11, 0.13, 0.14, 0.15, 0.14),
LowerBound = c(0.08, 0.10, 0.11, 0.12, 0.11),
UpperBound = c(0.14, 0.16, 0.17, 0.18, 0.17)
)
p2 <- Visualize_StudyKRI(
dfStudyKRI = dfStudyKRI,
dfBoundsRef = dfBoundsRef_old,
strStudyID = "STUDY1",
strMedianCol = "MedianMetric",
strLowerCol = "LowerBound",
strUpperCol = "UpperBound",
strYlab = "Cumulative AE Rate per Visit"
)
p2
 # Example 3: Plot with only study data (no bounds)
p3 <- Visualize_StudyKRI(
dfStudyKRI = dfStudyKRI,
strStudyID = "STUDY1",
strYlab = "Cumulative AE Rate per Visit"
)
p3
#> Warning: No shared levels found between `names(values)` of the manual scale and the
#> data's fill values.
# Example 3: Plot with only study data (no bounds)
p3 <- Visualize_StudyKRI(
dfStudyKRI = dfStudyKRI,
strStudyID = "STUDY1",
strYlab = "Cumulative AE Rate per Visit"
)
p3
#> Warning: No shared levels found between `names(values)` of the manual scale and the
#> data's fill values.