Create site with anomalous patients
anomaly.RdAverage
Usage
anomaly_average(df, anomaly_degree, site = "sample_site")

anomaly_sd(df, anomaly_degree, site = "sample_site")

anomaly_autocorr(df, anomaly_degree, site = "sample_site")

anomaly_autocorr2(df, anomaly_degree, site = "sample_site")

anomaly_lof(df, anomaly_degree, site = "sample_site", verbose = FALSE)

anomaly_range(df, anomaly_degree, site = "sample_site")

anomaly_unique_value_count_relative(df, anomaly_degree, site = "sample_site")Details
Here we add fractions of the lag to the result. The fraction is determined by the anomaly_degree.
Examples
set.seed(1)
library(ggplot2)
df_prep <- prep_sdtm_lb(pharmaversesdtm::lb, pharmaversesdtm::dm, scramble = TRUE)
df_filt <- df_prep %>%
filter(parameter_id == "Alkaline Phosphatase")
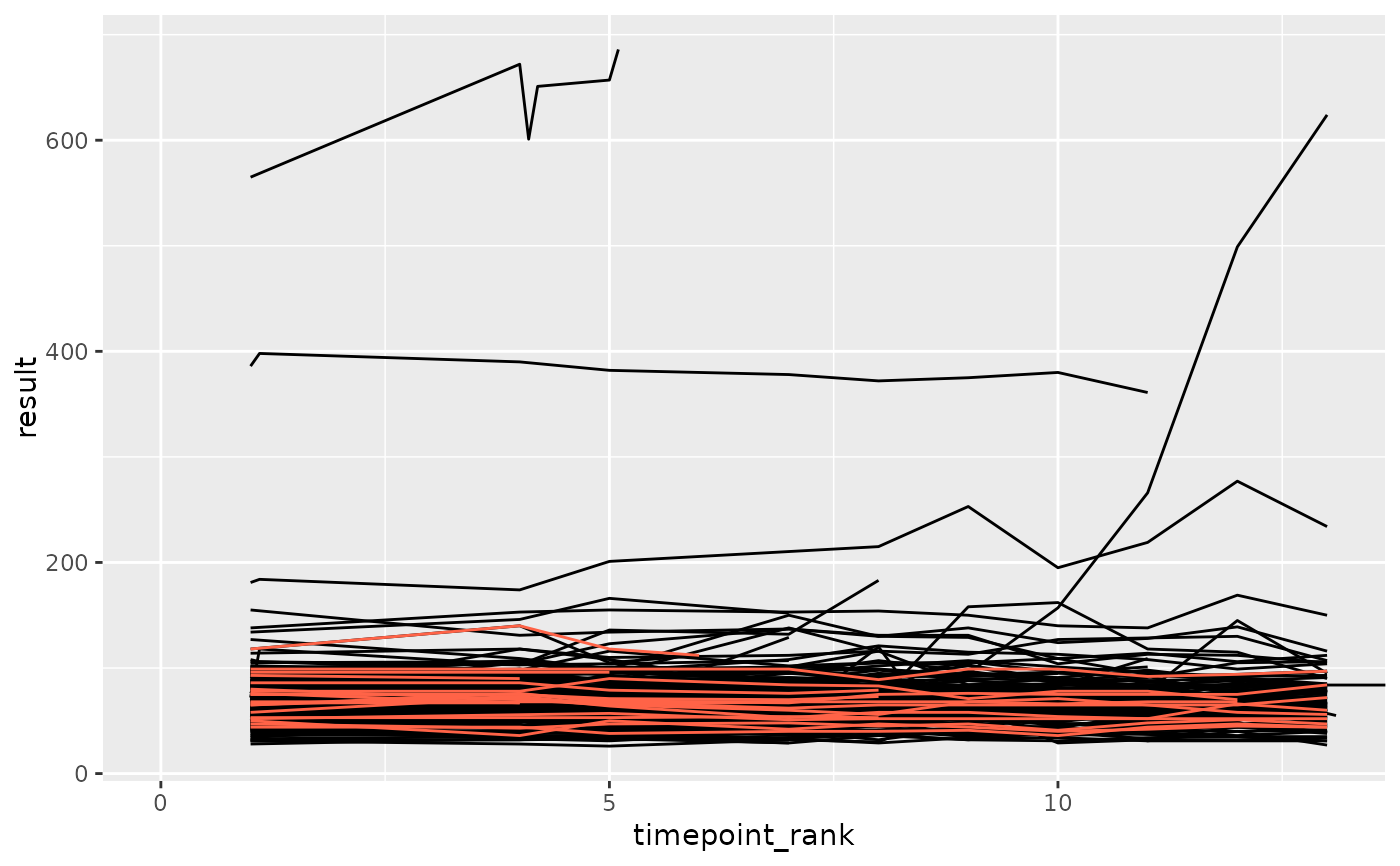
df_anomaly <- anomaly_average(df_filt, anomaly_degree = 2, site = "anomolous")
ggplot(df_filt, aes(x = timepoint_rank, y = result, group = subject_id)) +
geom_line(color = "black") +
geom_line(data = df_anomaly, color = "tomato") +
coord_cartesian(xlim = c(0, max(df_anomaly$timepoint_rank)))
 set.seed(1)
library(ggplot2)
df_prep <- prep_sdtm_lb(pharmaversesdtm::lb, pharmaversesdtm::dm, scramble = TRUE)
df_filt <- df_prep %>%
filter(parameter_id == "Alkaline Phosphatase")
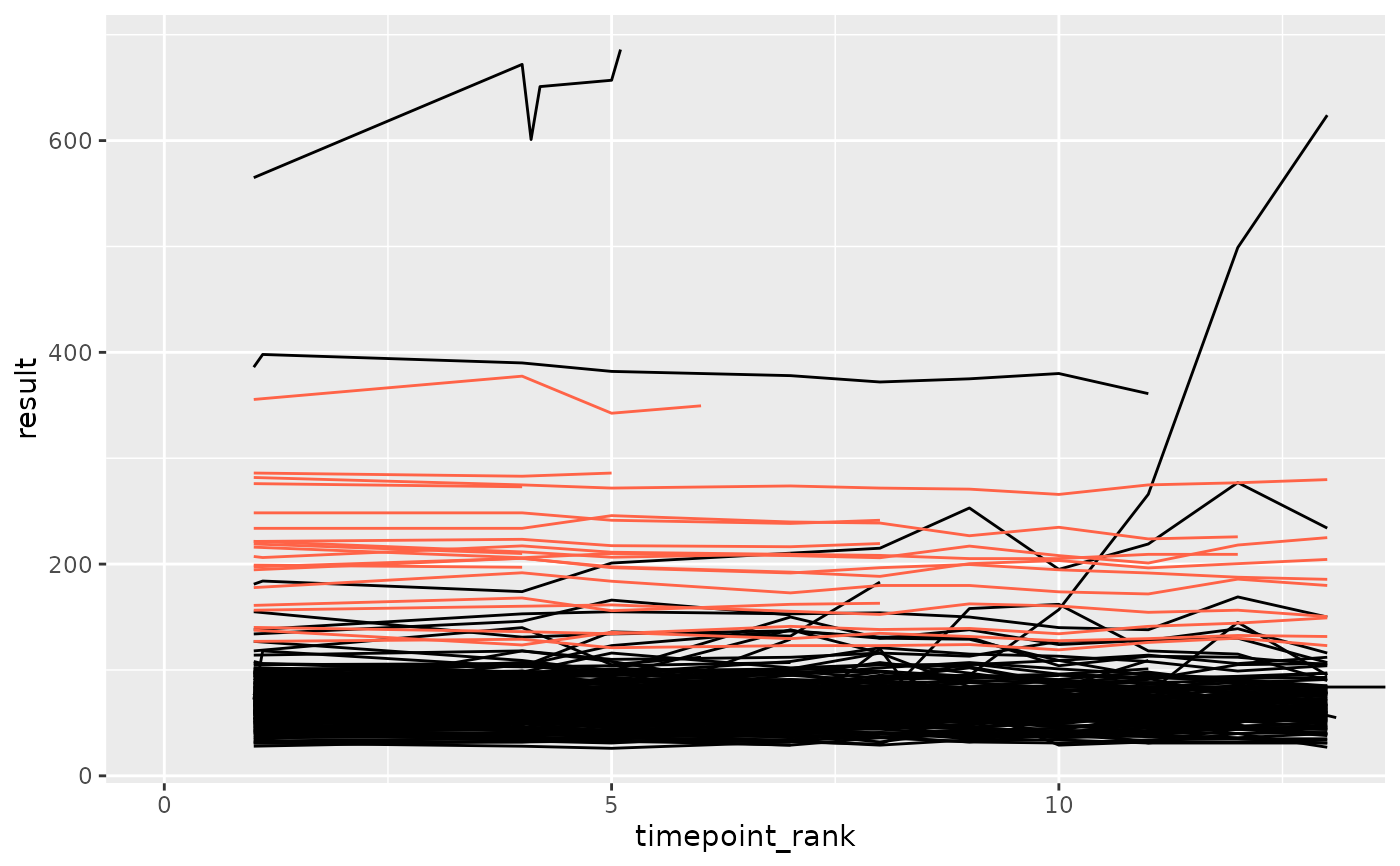
df_anomaly <- anomaly_sd(df_filt, anomaly_degree = 2, site = "anomolous")
ggplot(df_filt, aes(x = timepoint_rank, y = result, group = subject_id)) +
geom_line(color = "black") +
geom_line(data = df_anomaly, color = "tomato") +
coord_cartesian(xlim = c(0, max(df_anomaly$timepoint_rank)))
 set.seed(1)
library(ggplot2)
df_prep <- prep_sdtm_lb(pharmaversesdtm::lb, pharmaversesdtm::dm, scramble = TRUE)
df_filt <- df_prep %>%
filter(parameter_id == "Alkaline Phosphatase")
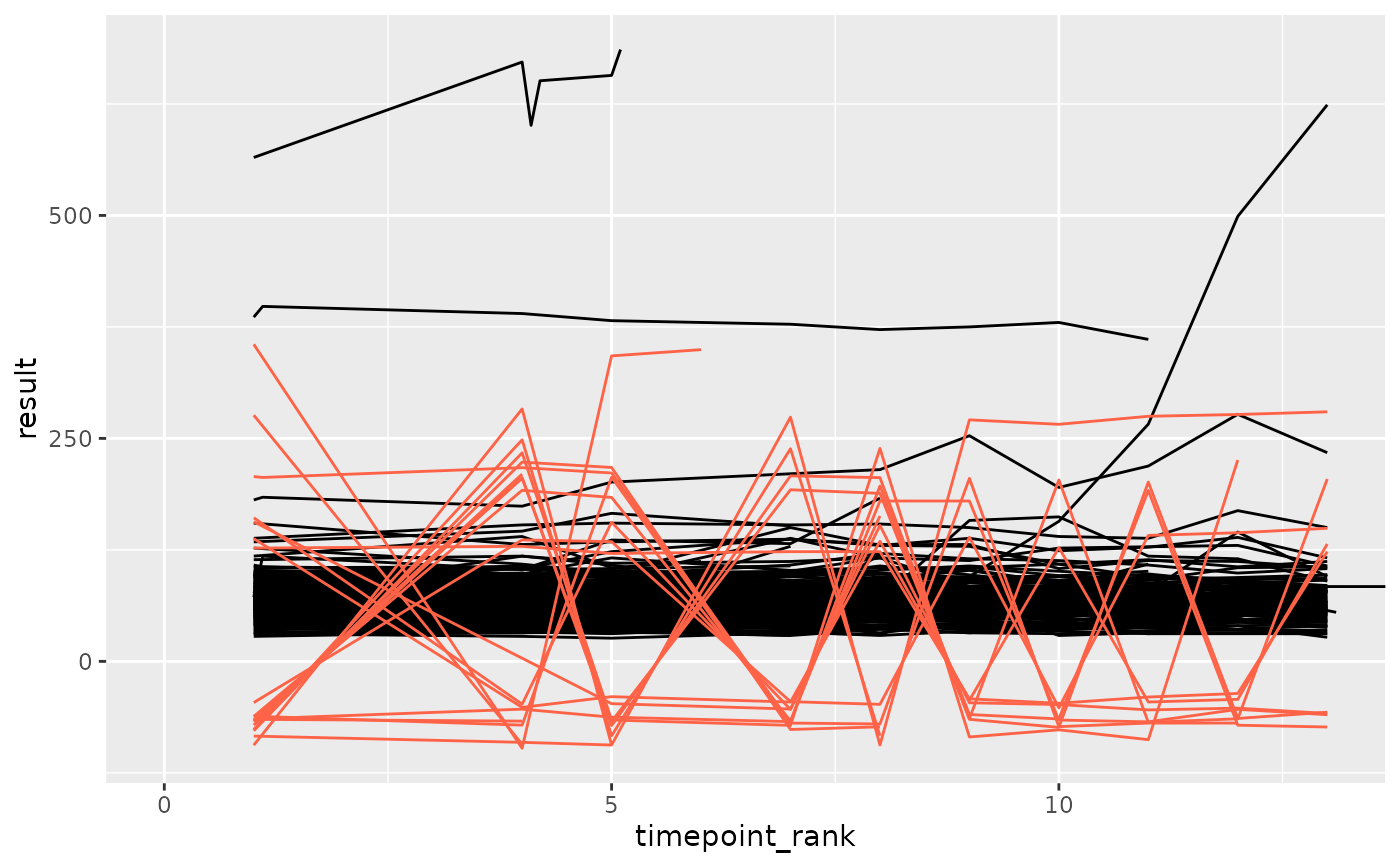
df_anomaly <- anomaly_autocorr(df_filt, anomaly_degree = 2, site = "anomolous")
ggplot(df_filt, aes(x = timepoint_rank, y = result, group = subject_id)) +
geom_line(color = "black") +
geom_line(data = df_anomaly, color = "tomato") +
coord_cartesian(xlim = c(0, max(df_anomaly$timepoint_rank)))
 set.seed(1)
library(ggplot2)
df_prep <- prep_sdtm_lb(pharmaversesdtm::lb, pharmaversesdtm::dm, scramble = TRUE)
df_filt <- df_prep %>%
filter(parameter_id == "Alkaline Phosphatase")
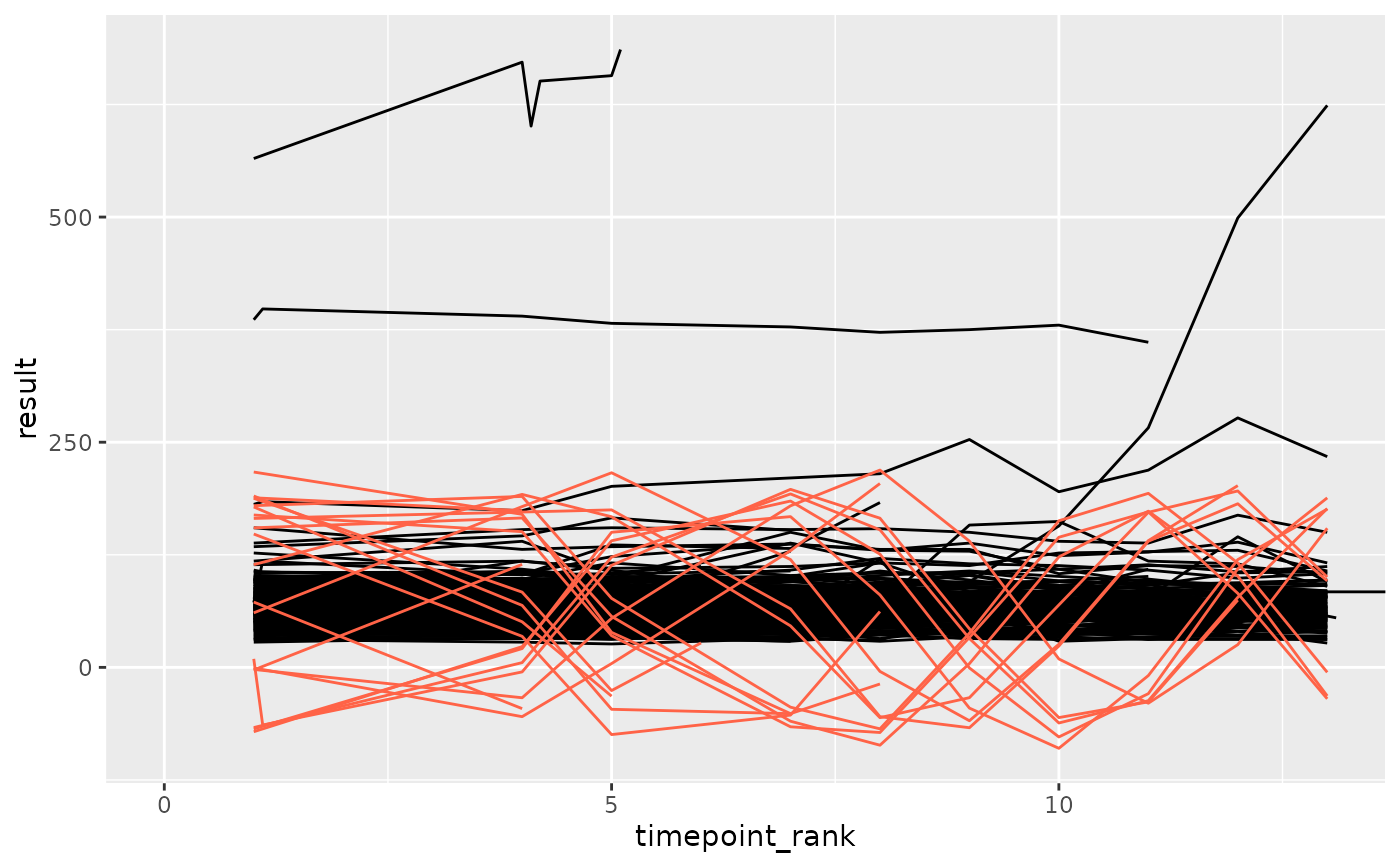
df_anomaly <- anomaly_autocorr2(df_filt, anomaly_degree = 1, site = "anomolous")
ggplot(df_filt, aes(x = timepoint_rank, y = result, group = subject_id)) +
geom_line(color = "black") +
geom_line(data = df_anomaly, color = "tomato") +
coord_cartesian(xlim = c(0, max(df_anomaly$timepoint_rank)))
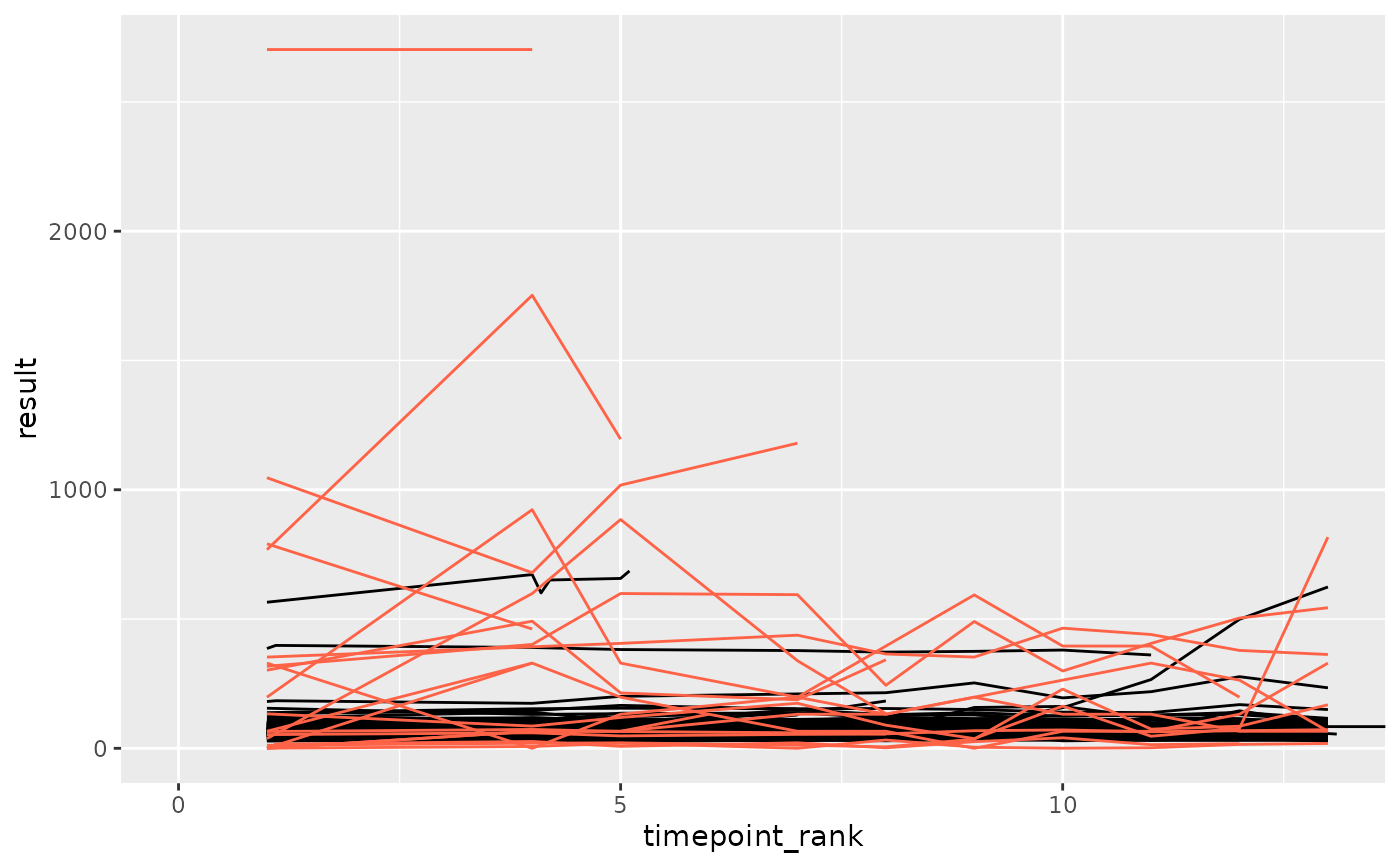 set.seed(1)
library(ggplot2)
df_prep <- prep_sdtm_lb(pharmaversesdtm::lb, pharmaversesdtm::dm, scramble = TRUE)
df_filt <- df_prep %>%
filter(parameter_id == "Alkaline Phosphatase")
df_anomaly <- anomaly_lof(df_filt, anomaly_degree = 2, site = "anomolous", verbose = TRUE)
#> Selected distribution: runif
#> Parameters: min = 1.7847; max = 9.6711
#> Selected distribution: rpois
#> Parameters: lambda = 1.3228
#> Selected distribution: rgamma
#> Parameters: shape = 8.7425; scale = 1.9169
#> Selected distribution: rpois
#> Parameters: lambda = 7.688
#> Selected distribution: rpois
#> Parameters: lambda = 1.312
#> Selected distribution: rpois
#> Parameters: lambda = 1.6909
#> Selected distribution: rexp
#> Parameters: rate = 1.8951
#> Selected distribution: rexp
#> Parameters: rate = 0.3266
#> Selected distribution: rgamma
#> Parameters: shape = 1.9628; scale = 0.5289
#> Selected distribution: rbinom
#> Parameters: size = 43; prob = 0.9261
#> Selected distribution: rpois
#> Parameters: lambda = 7.7639
#> Selected distribution: rpois
#> Parameters: lambda = 2.8724
#> Selected distribution: rexp
#> Parameters: rate = 1.3202
#> Selected distribution: rbeta
#> Parameters: shape1 = 1.0197; shape2 = 2.4954
#> Selected distribution: runif
#> Parameters: min = 4.9997; max = 7.6387
#> Selected distribution: runif
#> Parameters: min = 2.654; max = 7.685
#> Selected distribution: rgamma
#> Parameters: shape = 6.579; scale = 1.8946
#> Selected distribution: rpois
#> Parameters: lambda = 3.3932
#> Selected distribution: rgamma
#> Parameters: shape = 1.7505; scale = 1.5516
#> Selected distribution: rbeta
#> Parameters: shape1 = 0.6712; shape2 = 4.6334
#> Selected distribution: rbeta
#> Parameters: shape1 = 0.2613; shape2 = 3.5113
#> Selected distribution: rpois
#> Parameters: lambda = 9.4547
ggplot(df_filt, aes(x = timepoint_rank, y = result, group = subject_id)) +
geom_line(color = "black") +
geom_line(data = df_anomaly, color = "tomato") +
coord_cartesian(xlim = c(0, max(df_anomaly$timepoint_rank)))
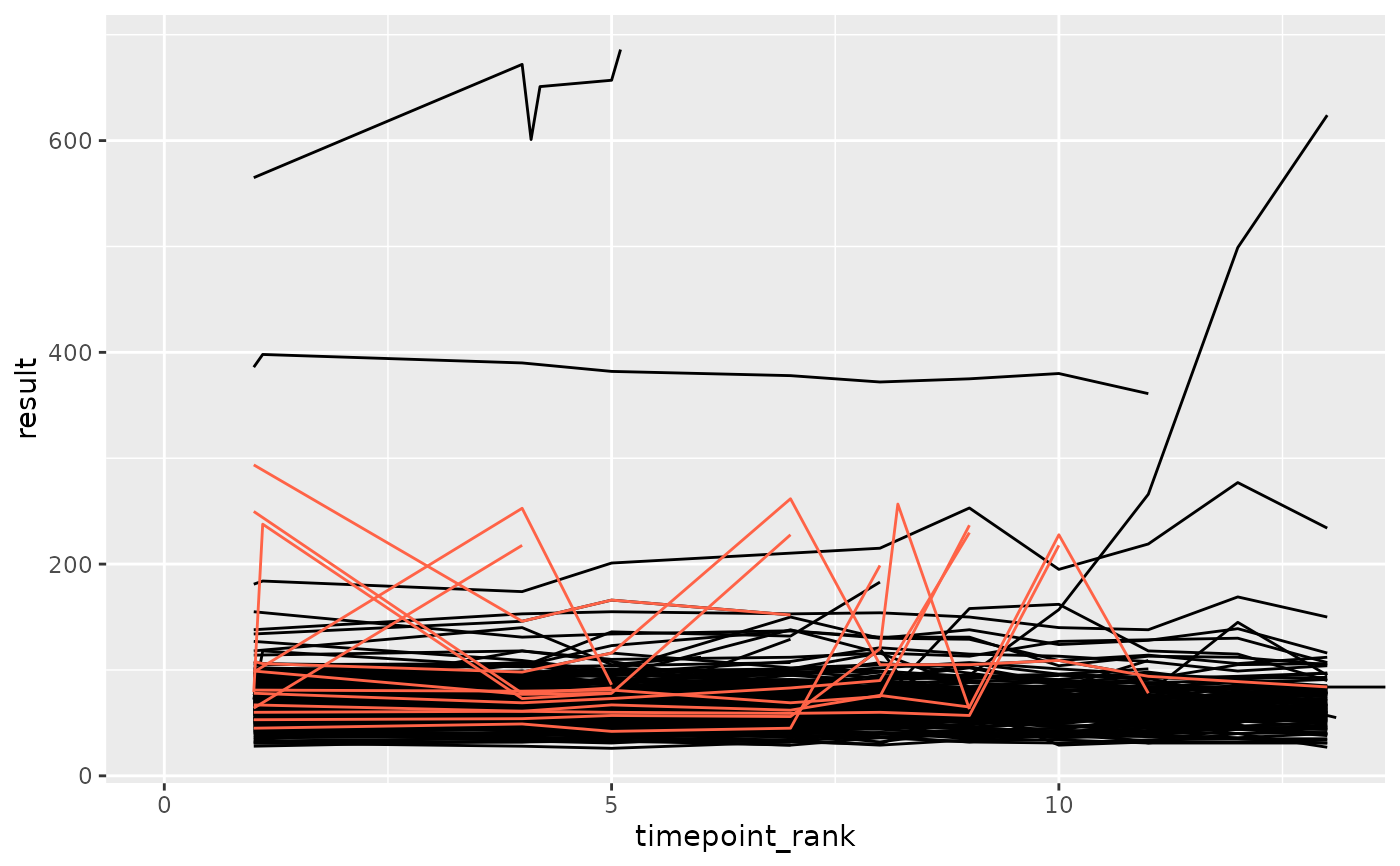 set.seed(7)
library(ggplot2)
df_prep <- prep_sdtm_lb(pharmaversesdtm::lb, pharmaversesdtm::dm, scramble = TRUE)
df_filt <- df_prep %>%
filter(parameter_id == "Alkaline Phosphatase")
df_anomaly <- anomaly_range(df_filt, anomaly_degree = 2, site = "anomolous")
ggplot(df_filt, aes(x = timepoint_rank, y = result, group = subject_id)) +
geom_line(color = "black") +
geom_line(data = df_anomaly, color = "tomato") +
coord_cartesian(xlim = c(0, max(df_anomaly$timepoint_rank)))
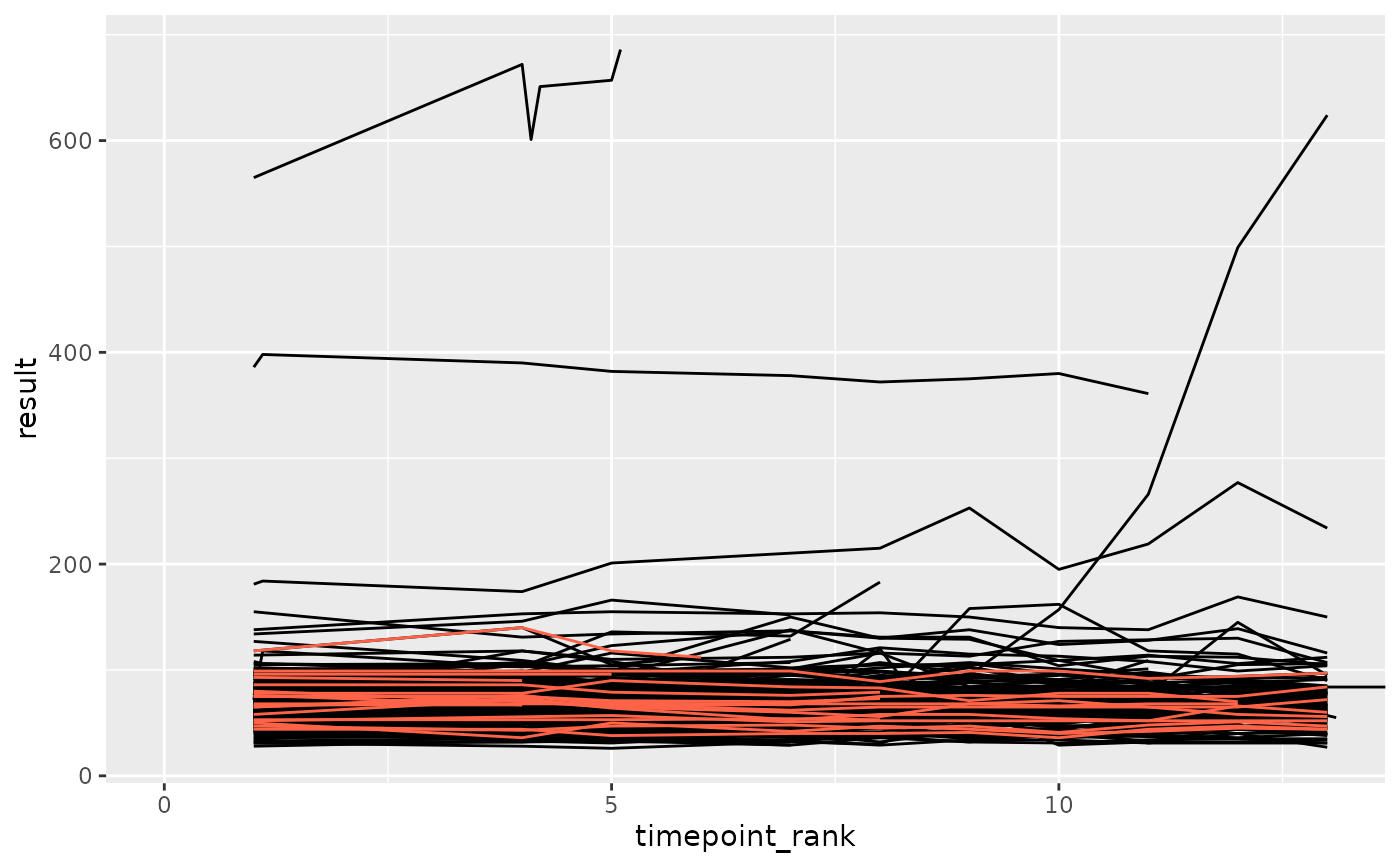 set.seed(1)
library(ggplot2)
df_prep <- prep_sdtm_lb(pharmaversesdtm::lb, pharmaversesdtm::dm, scramble = TRUE)
df_filt <- df_prep %>%
filter(parameter_id == "Alkaline Phosphatase")
df_anomaly <- anomaly_unique_value_count_relative(df_filt, anomaly_degree = 2, site = "anomolous")
ggplot(df_filt, aes(x = timepoint_rank, y = result, group = subject_id)) +
geom_line(color = "black") +
geom_line(data = df_anomaly, color = "tomato") +
coord_cartesian(xlim = c(0, max(df_anomaly$timepoint_rank)))
