The goal of ctasval is to provide structured code to validate {ctas} performance on study data.
Installation
You can install the development version of ctasval from GitHub with:
# install.packages("devtools")
devtools::install_github("IMPALA-Consortium/ctas")
devtools::install_github("IMPALA-Consortium/ctasval")
ctasval
ctasval adds three anomalous sites to the data set for each iteration and tries to detect them using {ctas}. It samples from the study site pool to first determine the number of patients and then samples a sufficient number of patients from the study patient pool.
library(pharmaversesdtm)
library(dplyr)
#>
#> Attaching package: 'dplyr'
#> The following objects are masked from 'package:stats':
#>
#>     filter, lag
#> The following objects are masked from 'package:base':
#>
#>     intersect, setdiff, setequal, union
library(future)
#> Warning: package 'future' was built under R version 4.4.3
library(ctasval)
library(ggplot2)
#> Warning: package 'ggplot2' was built under R version 4.4.3
library(tidyr)


set.seed(1)

df_prep <- prep_sdtm(
  lb = pharmaversesdtm::lb,
  vs = pharmaversesdtm::vs,
  dm = pharmaversesdtm::dm,
  scramble = TRUE
)

df_filt <- df_prep %>%
  filter(parameter_id %in% c("Pulse Rate", "Alanine Aminotransferase")) %>%
  filter(! grepl("UNSCH", timepoint_1_name) & !timepoint_1_name %in% c("AMBUL ECG REMOVAL", "RETRIEVAL"))
Note: On some systems, running multiple ctasval chunks with multiprocessing in the same R session may cause hangs or memory issues. If you experience this, restart your R session between running different ctasval chunks.
plan(multisession, workers = 6)

ctas <- ctasval(
  df = df_filt,
  fun_anomaly = c(
    anomaly_average,
    anomaly_sd,
    anomaly_autocorr2,
    anomaly_lof,
    anomaly_range,
    anomaly_unique_value_count_relative
  ),
  feats = c("average", "sd", "autocorr", "lof", "range", "unique_value_count_relative"),
  parallel = TRUE,
  iter = 50,
  n_sites = 3,
  anomaly_degree = c(0, 0.25, 0.5, 0.75, 1, 5, 10),
  thresh = 1.3,
  site_scoring_method = "ks"
)

arrow::write_parquet(ctas$result, "ctas_ks_result.parquet")

ctas$anomaly %>%
  arrow::write_parquet("ctas_ks_anomaly.parquet")

ctas$scores %>%
  arrow::write_parquet("ctas_ks_scores.parquet")
Performance Metrics
ctas_result <- arrow::read_parquet("ctas_ks_result.parquet")

ctas_result %>%
  tidyr::pivot_longer(c(tpr, fpr), values_to = "metric", names_to = "metric_type") %>%
  ggplot(aes(log(anomaly_degree),  metric)) +
  geom_line(aes(linetype = metric_type)) +
  geom_point() +
  facet_grid(parameter_id ~ feats) +
  theme(legend.position = "bottom")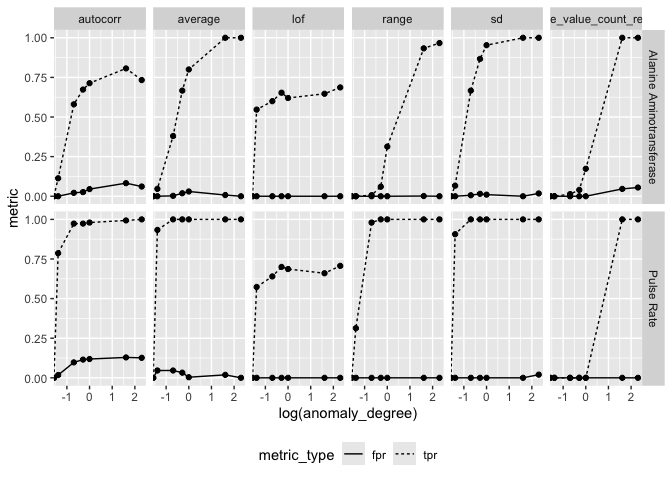
Mixed Effect Scoring
plan(multisession, workers = 6)

ctas <- ctasval(
  df = df_filt,
  fun_anomaly = c(
    anomaly_average,
    anomaly_sd,
    anomaly_autocorr2,
    anomaly_lof,
    anomaly_range,
    anomaly_unique_value_count_relative
  ),
  feats = c("average", "sd", "autocorr", "lof", "range", "unique_value_count_relative"),
  parallel = TRUE,
  iter = 50,
  n_sites = 3,
  anomaly_degree = c(0, 0.25, 0.5, 0.75, 1, 5, 10),
  thresh = 1.3,
  site_scoring_method = "mixedeffects"
)

arrow::write_parquet(ctas$result, "ctas_mixedeffects_result.parquet")

ctas$anomaly %>%
  arrow::write_parquet("ctas_mixedeffects_anomaly.parquet")

ctas$scores %>%
  arrow::write_parquet("ctas_mixedeffects_scores.parquet")
ctas_result <- arrow::read_parquet("ctas_mixedeffects_result.parquet")

ctas_result %>%
  tidyr::pivot_longer(c(tpr, fpr), values_to = "metric", names_to = "metric_type") %>%
  ggplot(aes(log(anomaly_degree),  metric)) +
  geom_line(aes(linetype = metric_type)) +
  geom_point() +
  facet_grid(parameter_id ~ feats) +
  theme(legend.position = "bottom")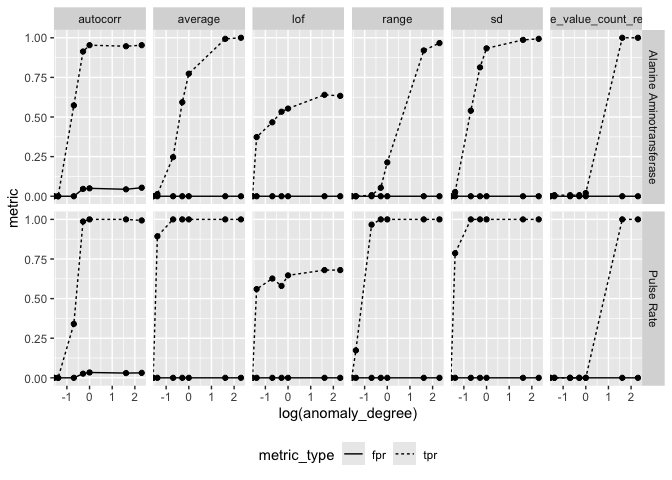
Average Box Plot Scoring
plan(multisession, workers = 6)

ctas <- ctasval(
  df = df_filt,
  fun_anomaly = c(
    anomaly_average,
    anomaly_sd,
    anomaly_autocorr2,
    anomaly_lof,
    anomaly_range,
    anomaly_unique_value_count_relative
  ),
  feats = c("average", "sd", "autocorr", "lof", "range", "unique_value_count_relative"),
  parallel = TRUE,
  iter = 50,
  n_sites = 3,
  anomaly_degree = c(0, 0.25, 0.5, 0.75, 1, 5, 10),
  site_scoring_method = "avg_feat_value"
)

arrow::write_parquet(ctas$result, "ctas_avgfeat_result.parquet")

ctas$anomaly %>%
  arrow::write_parquet("ctas_avgfeat_anomaly.parquet")

ctas$scores %>%
  arrow::write_parquet("ctas_avgfeat_scores.parquet")
ctas_result <- arrow::read_parquet("ctas_avgfeat_result.parquet")

ctas_result %>%
  tidyr::pivot_longer(c(tpr, fpr), values_to = "metric", names_to = "metric_type") %>%
  ggplot(aes(log(anomaly_degree),  metric)) +
  geom_line(aes(linetype = metric_type)) +
  geom_point() +
  facet_grid(parameter_id ~ feats) +
  theme(legend.position = "bottom")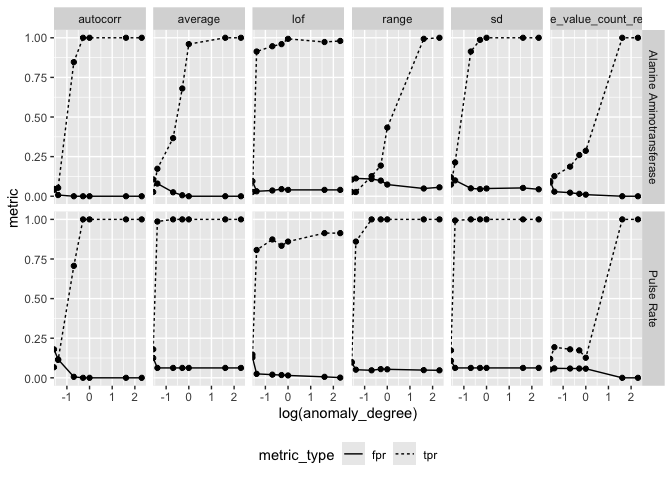
Anamolous Sites
Anomalous Sites and their scores can be reviewed.
ctas_anomaly <- arrow::read_parquet("ctas_avgfeat_anomaly.parquet")

ctas_anomaly %>%
  select(
    iter,
    anomaly_degree,
    feats,
    parameter_id,
    site,
    subject_id,
    timepoint_rank,
    result,
    score
  ) %>%
  arrange(iter, desc(anomaly_degree), parameter_id, feats, site, subject_id, timepoint_rank) %>%
  head(25) %>%
knitr::kable()| iter | anomaly_degree | feats | parameter_id | site | subject_id | timepoint_rank | result | score |
|---|---|---|---|---|---|---|---|---|
| 1 | 10 | autocorr | Alanine Aminotransferase | sample_site1 | sample_site1-01-701-1440 | 1 | 21 | 1 |
| 1 | 10 | autocorr | Alanine Aminotransferase | sample_site1 | sample_site1-01-701-1440 | 4 | 228 | 1 |
| 1 | 10 | autocorr | Alanine Aminotransferase | sample_site1 | sample_site1-01-701-1440 | 5 | 2298 | 1 |
| 1 | 10 | autocorr | Alanine Aminotransferase | sample_site1 | sample_site1-01-701-1440 | 7 | 23006 | 1 |
| 1 | 10 | autocorr | Alanine Aminotransferase | sample_site1 | sample_site1-01-701-1440 | 8 | 230080 | 1 |
| 1 | 10 | autocorr | Alanine Aminotransferase | sample_site1 | sample_site1-01-701-1440 | 9 | 2300812 | 1 |
| 1 | 10 | autocorr | Alanine Aminotransferase | sample_site1 | sample_site1-01-701-1440 | 10 | 23008142 | 1 |
| 1 | 10 | autocorr | Alanine Aminotransferase | sample_site1 | sample_site1-01-701-1440 | 11 | 230081437 | 1 |
| 1 | 10 | autocorr | Alanine Aminotransferase | sample_site1 | sample_site1-01-701-1440 | 12 | 2300814388 | 1 |
| 1 | 10 | autocorr | Alanine Aminotransferase | sample_site1 | sample_site1-01-701-1440 | 13 | 23008143897 | 1 |
| 1 | 10 | autocorr | Alanine Aminotransferase | sample_site1 | sample_site1-01-704-1435 | 1 | 13 | 1 |
| 1 | 10 | autocorr | Alanine Aminotransferase | sample_site1 | sample_site1-01-704-1435 | 4 | 143 | 1 |
| 1 | 10 | autocorr | Alanine Aminotransferase | sample_site1 | sample_site1-01-704-1435 | 5 | 1444 | 1 |
| 1 | 10 | autocorr | Alanine Aminotransferase | sample_site1 | sample_site1-01-704-1435 | 7 | 14450 | 1 |
| 1 | 10 | autocorr | Alanine Aminotransferase | sample_site1 | sample_site1-01-704-1435 | 8 | 144509 | 1 |
| 1 | 10 | autocorr | Alanine Aminotransferase | sample_site1 | sample_site1-01-709-1217 | 1 | 19 | 1 |
| 1 | 10 | autocorr | Alanine Aminotransferase | sample_site1 | sample_site1-01-709-1217 | 4 | 213 | 1 |
| 1 | 10 | autocorr | Alanine Aminotransferase | sample_site1 | sample_site1-01-709-1217 | 5 | 2150 | 1 |
| 1 | 10 | autocorr | Alanine Aminotransferase | sample_site1 | sample_site1-01-709-1217 | 7 | 21514 | 1 |
| 1 | 10 | autocorr | Alanine Aminotransferase | sample_site1 | sample_site1-01-709-1217 | 8 | 215159 | 1 |
| 1 | 10 | autocorr | Alanine Aminotransferase | sample_site1 | sample_site1-01-709-1217 | 9 | 2151609 | 1 |
| 1 | 10 | autocorr | Alanine Aminotransferase | sample_site1 | sample_site1-01-709-1217 | 10 | 21516106 | 1 |
| 1 | 10 | autocorr | Alanine Aminotransferase | sample_site1 | sample_site1-01-717-1004 | 1 | 24 | 1 |
| 1 | 10 | autocorr | Alanine Aminotransferase | sample_site1 | sample_site1-01-717-1004 | 4 | 259 | 1 |
| 1 | 10 | autocorr | Alanine Aminotransferase | sample_site1 | sample_site1-01-717-1004 | 5 | 2610 | 1 |
Scores
Maximum scores obtained for each site in each iteration from all autogenerated time series can be reviewed.
ctas_scores <- arrow::read_parquet("ctas_avgfeat_scores.parquet")

ctas_scores %>%
  head(25) %>%
knitr::kable()| iter | anomaly_degree | feats | site | parameter_id | max_score |
|---|---|---|---|---|---|
| 1 | 0 | average | 709 | Alanine Aminotransferase | 0 |
| 1 | 0 | average | 708 | Alanine Aminotransferase | 0 |
| 1 | 0 | average | 718 | Alanine Aminotransferase | 0 |
| 1 | 0 | average | 716 | Alanine Aminotransferase | 0 |
| 1 | 0 | average | 710 | Alanine Aminotransferase | 0 |
| 1 | 0 | average | 704 | Alanine Aminotransferase | 0 |
| 1 | 0 | average | 701 | Alanine Aminotransferase | 0 |
| 1 | 0 | average | 705 | Alanine Aminotransferase | 0 |
| 1 | 0 | average | 717 | Alanine Aminotransferase | 1 |
| 1 | 0 | average | 703 | Alanine Aminotransferase | 0 |
| 1 | 0 | average | 707 | Alanine Aminotransferase | 0 |
| 1 | 0 | average | 715 | Alanine Aminotransferase | 0 |
| 1 | 0 | average | 711 | Alanine Aminotransferase | 0 |
| 1 | 0 | average | 713 | Alanine Aminotransferase | 0 |
| 1 | 0 | average | 706 | Alanine Aminotransferase | 0 |
| 1 | 0 | average | 714 | Alanine Aminotransferase | 0 |
| 1 | 0 | average | 709 | Pulse Rate | 0 |
| 1 | 0 | average | 708 | Pulse Rate | 0 |
| 1 | 0 | average | 718 | Pulse Rate | 0 |
| 1 | 0 | average | 716 | Pulse Rate | 0 |
| 1 | 0 | average | 710 | Pulse Rate | 0 |
| 1 | 0 | average | 704 | Pulse Rate | 0 |
| 1 | 0 | average | 701 | Pulse Rate | 0 |
| 1 | 0 | average | 705 | Pulse Rate | 0 |
| 1 | 0 | average | 717 | Pulse Rate | 0 |
Publication
these commands render publication to pub/
to edit publication edit inst/pub/ctasvalidation.qmd
quarto::quarto_render("inst/pub/ctasvalidation.qmd", output_format = "html")
quarto::quarto_render("inst/pub/ctasvalidation.qmd", output_format = "docx")
quarto::quarto_render("inst/pub/ctasvalidation.qmd", output_format = "pdf")
quarto::quarto_render("inst/pub/ctasvalidation.qmd", output_format = "latex")